Observability Made Easy: Building a RESTful API with Actix Web and OpenTelemetry
Cloud Native Pilgrim | Kubernetes Enthusiast | Serverless Believer | Customer Experience Architect @ Pulumi | (he/him) | CK{A,AD} |
TL;DR: Le Code
Introduction
We keep reading about the importance of Observability in our applications. Charity Majors CEO of Honeycomb made a very good tweet thread in 2018(!!)
And this great blog post from Dotan Horovits:
Or this page created by Michael Friedrich
Aurélie Vache made a good blog article for Golang!
There are numerous tools and frameworks that we can use during development to offer an Observability layer. In this article, we will add OpenTelemetry to our REST API with Actix Web application we developed in the previous article. If you haven't read the previous article:
Let's talk first about Observability and OpenTelemetry to build a basic understanding before we head over to the code part.
Observability?
When we talk about Observability, we are referring to the ability to monitor, understand, and troubleshoot the internal state of a system based on its external outputs. It is a crucial aspect of modern software development and operations (DevOps) that helps ensure the reliability, stability, and performance of applications. Observability is achieved through the collection and analysis of various types of telemetry data, such as logs, metrics, and traces.
Why is Observability important?
Complexity
Modern applications are often complex, distributed, and composed of multiple microservices. This makes it difficult to pinpoint the root cause of issues when they arise. Observability helps developers and operators gain insights into the application's behavior, making it easier to identify and resolve problems.
Continuous deployment
In a fast-paced development environment, frequent changes are made to applications. Observability ensures that issues introduced by these changes are quickly detected and addressed, reducing downtime and ensuring a smooth user experience.
Scalability
As applications grow and scale, so do the number of components and services that need to be monitored. Observability enables the tracking of these components, ensuring that performance remains consistent even as the system expands.
Is Observability not the same as Monitoring?
The fact is, monitoring (or application performance monitoring) is a subset of Observability and a step towards achieving it. Observability itself uses different types of telemetry data to provide insights into the state of the system and to understand the reason for any issues that may arise.
Here's a simpler version of the difference between Observability and monitoring:
Monitoring uses set data, dashboards, and alerts to check how well applications and systems work.
Observability lets you understand what's happening inside complex systems that change over time by looking at all the information available right away.
Three Pillars of Observability

The three components of Observability (logs, metrics, and traces) are often referred to as the Three Pillars of Observability:
Metrics: Metrics are numerical values that are used to measure the health and performance of a system.
Logs: A timestamped sequence of events that provide insight into the behavior of a system. While metrics show the first signs of a problem, logs provide you with the context to understand the root cause.
Traces: Traces are a set of events that occur in a distributed system, and are used to understand the flow of requests through the system. When a request moves through a distributed system, it is called a span.
The Benefits of Observability:
Faster issue resolution
Observability helps to quickly identify the root cause of issues, reducing the mean time to resolution (MTTR) and minimizing the impact on users.
Proactive problem detection
Observability allows for the early detection of potential problems, enabling teams to take preventive measures before they escalate and affect users.
Improved performance
By providing visibility into how applications are performing, Observability allows teams to optimize and fine-tune their systems, resulting in better performance and a higher-quality user experience.
Data-driven decision-making
Observability provides valuable insights into application behavior, which can be used to make informed decisions about system architecture, design, and resource allocation.
Enhanced collaboration
Observability promotes a shared understanding of the system's state, fostering better collaboration between development and operations teams, and improving overall software delivery efficiency.
Prerequisites
An IDE or text editor of your choice
Docker and
docker-composeinstalledoptional: If you want to interact with the PostgreSQL database, you can install psql with
brew install postgresqlThe code from the last blog article, which you can find here
%[https://github.com/dirien/quick-bites/tree/main/rust-actix-web-rest-api-diesel]
Setting up the Database
We're going to use the same way to set up the database as we did in the previous article. Simply run the following command
docker-compose -f postgres.yml up -d
And run the diesel cli to create the database and the tables
diesel setup
diesel migration run
As part of the up.sql migration, we create two tables. The first one is the todos table and the second one is the categories table. The todos table has a foreign key category_id to the categories table.
We also pre-populate the categories table with some categories.
CREATE SEQUENCE categories_id_seq;

CREATE TABLE categories
(
    id          INTEGER PRIMARY KEY DEFAULT nextval('categories_id_seq'),
    name        VARCHAR(255) NOT NULL,
    description TEXT
);

CREATE TABLE todos
(
    id          VARCHAR(255) PRIMARY KEY,
    title       VARCHAR(255) NOT NULL,
    description TEXT,
    created_at  TIMESTAMP,
    updated_at  TIMESTAMP,
    category_id INTEGER,
    FOREIGN KEY (category_id) REFERENCES categories (id)
);

INSERT INTO categories (name, description)
VALUES ('Work', 'Tasks related to work or job responsibilities'),
       ('Personal', 'Personal tasks and errands'),
       ('Health', 'Health and fitness related tasks'),
       ('Hobbies', 'Tasks related to hobbies and interests'),
       ('Education', 'Tasks related to learning and education');
In the src/repository/database.rs file, I created two new functions to get all categories and all todos with joined categories. I use a new struct called TodoItemData to return all the data I need for API responses rather than calling two separate functions to get the todos and the categories.
In a real-world application, I would probably create a backend for frontend (BFF) service that would call the backend API and return the data in a format that is easier to work with on the frontend.
pub fn get_categories(&self) -> Vec<Category> {
    categories
        .load::<Category>(&mut self.pool.get().unwrap())
        .expect("Error loading all categories")
}

pub fn get_todos_with_category(&self) -> Vec<TodoItemData> {
    let mut empty_todo_item_data_list: Vec<TodoItemData> = Vec::new();
    todos
        .inner_join(categories)
        .load::<(Todo, Category)>(&mut self.pool.get().unwrap())
        .expect("Error loading all todos")
        .into_iter()
        .for_each(|(todo, category)| {
            println!("todo: {:?}, category: {:?}", todo, category);
            let todo_item_data = TodoItemData {
                id: todo.id,
                title: todo.title,
                description: todo.description,
                created_at: todo.created_at,
                updated_at: todo.updated_at,
                category: Some(CategoryData {
                    id: category.id,
                    name: category.name,
                    description: category.description,
                }),
            };
            empty_todo_item_data_list.push(todo_item_data);
        });
    empty_todo_item_data_list
}
Why OpenTelemetry?
Numerous Observability platforms currently exist, offering in-depth insights into your code and displaying traces, such as Dynatrace, NewRelic, DataDog, etc. So, what makes OpenTelemetry a desirable choice?
OpenTelemetry addresses a significant challenge: establishing a standard for reporting and transmitting measurements.
By using OpenTelemetry with Solution A, you can effortlessly switch to Solution B as your Observability platform without losing any trace history.
As a result, OpenTelemetry has emerged as the go-to standard for many organizations implementing Observability in their systems.
Setting up OpenTelemetry

Before we can start to add OpenTelemetry code to our application, we need to import some necessary crates.
cargo add actix_web_opentelemetry - - features opentelemetry-prometheus,metrics,metrics-prometheus,prometheus
cargo add opentelemetry - - features=rt-tokio,trace
cargo add opentelemetry-jaeger - - features=collector_client,rt-tokio,isahc_collector_client,isahc_collector_client
cargo add tracing-opentelemetry
cargo add tracing
cargo add tracing-bunyan-formatter
cargo add tracing-subscriber - - features=env-filter,registry
If you're not going to use jaeger as your tracing backend, you can remove the opentelemetry-jaeger crate and change it to opentelemetry-otlp or opentelemetry-zipkin crate. See the OpenTelemetry Rust Crates list for more information.
To set up the tracing layers and metrics exporter, we need to create a new file called tracing.rs in the src folder.
use actix_web_opentelemetry::{PrometheusMetricsHandler, RequestMetricsBuilder};
use dotenv::dotenv;
use opentelemetry::sdk::export::metrics::aggregation;
use opentelemetry::sdk::metrics::{controllers, processors};
use opentelemetry::{global, sdk};
use tracing_bunyan_formatter::{BunyanFormattingLayer, JsonStorageLayer};
use tracing_subscriber::{EnvFilter, Registry};
use tracing_subscriber::{prelude::*};

#[derive(Debug, Clone)]
pub struct OpenTelemetryStack {
    request_metrics: actix_web_opentelemetry::RequestMetrics,
    metrics_handler: PrometheusMetricsHandler,
}

impl OpenTelemetryStack {
    pub fn new() -> Self {
        dotenv().ok();
        let app_name = std::env::var("CARGO_BIN_NAME").unwrap_or("demo".to_string());

        global::set_text_map_propagator(opentelemetry_jaeger::Propagator::new());
        let tracer = opentelemetry_jaeger::new_agent_pipeline()
            .with_endpoint(std::env::var("JAEGER_ENDPOINT").unwrap_or("localhost:6831".to_string()))
            .with_service_name(app_name.clone())
            .install_batch(opentelemetry::runtime::Tokio)
            .expect("Failed to install OpenTelemetry tracer.");

        let telemetry = tracing_opentelemetry::layer().with_tracer(tracer);
        let env_filter = EnvFilter::try_from_default_env().unwrap_or(EnvFilter::new("INFO"));
        let formatting_layer = BunyanFormattingLayer::new(app_name.clone().into(), std::io::stdout);
        let subscriber = Registry::default()
            .with(telemetry)
            .with(JsonStorageLayer)
            .with(formatting_layer)
            .with(env_filter);
        tracing::subscriber::set_global_default(subscriber)
            .expect("Failed to install `tracing` subscriber.");

        let controller = controllers::basic(processors::factory(
            sdk::metrics::selectors::simple::histogram([0.1, 0.5, 1.0, 2.0, 5.0, 10.0]),
            aggregation::cumulative_temporality_selector(),
        )).build();
        let prometheus_exporter = opentelemetry_prometheus::exporter(controller).init();
        let meter = global::meter("global");
        let request_metrics = RequestMetricsBuilder::new().build(meter);
        let metrics_handler = PrometheusMetricsHandler::new(prometheus_exporter.clone());
        Self {
            request_metrics,
            metrics_handler
        }
    }

    pub fn metrics(&self) -> actix_web_opentelemetry::RequestMetrics {
        self.request_metrics.clone()
    }

    pub fn metrics_handler(&self) -> PrometheusMetricsHandler {
        self.metrics_handler.clone()
    }
}
In the OpenTelemetryStack struct, we create a new RequestMetrics and PrometheusMetricsHandler instance. In the implementation block of the OpenTelemetryStack struct, we initialize the tracing subscriber and the metrics exporter in the new function.
The endpoint of the opentelemetry_jaeger crate is set to localhost:6831 by default. If you're using a different endpoint, you can change it by setting the JAEGER_ENDPOINT environment variable. In the next step, we initialize an environment filter (EnvFilter) that determines which trace events to collect based on their log levels. It attempts to create the filter using the default environment configuration. If it fails, it falls back to creating a filter with the INFO log level.
The BunyanFormattingLayer is used to format the logs in a way that is compatible with the Bunyan log format, which is a popular JSON-based logging format. Then we add all these layers to the tracing subscriber.
The opentelemetry_prometheus crate is used to export metrics to Prometheus. The controllers::basic function is used to initialize the metrics controller using a basic controller provided by the OpenTelemetry SDK. sdk::metrics:: selectors::simple::histogram([0.1, 0.5, 1.0, 2.0, 5.0, 10.0]), sets up a simple histogram selector with the specified boundaries for aggregating metric data. The boundaries are [0.1, 0.5, 1.0, 2.0, 5.0, 10.0]. The aggregation::cumulative_temporality_selector(), line configures the aggregation to use cumulative temporality, meaning the metric values will be aggregated over time, rather than being reset periodically.
let meter = global::meter("global"); retrieves a global meter instance with the name global (creative I know!). Meters are responsible for creating and recording metric instruments.
The next two lines create a new RequestMetrics and PrometheusMetricsHandler instance with the previously created meter and exporter.
Wiring up OpenTelemetry in Actix
With the tracing.rs file in place and the heavy lifting done, we can now wire up OpenTelemetry in our Actix application.
Head over to the main.rs file and change the main function to the following:
#[actix_web::main]
async fn main() -> std::io::Result<()> {
    let todo_db = repository::database::Database::new();
    let app_data = web::Data::new(todo_db);

    let telemetry = telemetry::OpenTelemetryStack::new();
    let telemetry_data = web::Data::new(telemetry.clone());

    HttpServer::new(move || {
        App::new()
            .app_data(app_data.clone())
            .app_data(telemetry_data.clone())
            .configure(api::api::config)
            .service(healthcheck)
            .service(metrics)
            .default_service(web::route().to(not_found))
            .wrap(actix_web::middleware::Logger::default())
            .wrap(RequestTracing::new())
            .wrap(telemetry.metrics())
    })
        .bind(("127.0.0.1", 8080))?
        .run()
        .await
}
The telemetry variable is initialized with the OpenTelemetryStack struct. The telemetry_data variable is used to pass the telemetry variable to the App instance. The telemetry.metrics() function is used to create a new RequestMetrics instance that is used to collect metrics for the Actix application.
Adding the #[tracing::instrument] attribute
The #[tracing::instrument] attribute is used to instrument the code. It adds spans to the code and adds the tracing context to the logs. The #[tracing::instrument] attribute is added to all the functions in the api module.
Here's an example of the create_todo function in the todos module:
#[post("/todos")]
#[tracing::instrument]
pub async fn create_todo(db: web::Data<Database>, new_todo: web::Json<Todo>) -> HttpResponse {
    let todo = db.create_todo(new_todo.into_inner());
    match todo {
        Ok(todo) => HttpResponse::Ok().json(todo),
        Err(err) => HttpResponse::InternalServerError().body(err.to_string()),
    }
}

// rest of the code is omitted for brevity
The metrics endpoint
The /metrics endpoint is used to expose the metrics to Prometheus. The metrics endpoint is added to the Actix and looks like this:
#[get("/metrics")]
async fn metrics(telemetry: web::Data<telemetry::OpenTelemetryStack>, db: web::Data<Database>, request: HttpRequest) -> impl Responder {
    let categories = db.get_categories();
    let todos = db.get_todos();

    let meter = global::meter("global");
    let todo_count = meter.i64_observable_gauge("todo_count").with_description("Number of todos").init();
    let category_count = meter.i64_observable_gauge("category_count").with_description("Number of categories").init();

    let cx = Context::current();
    todo_count.observe(&cx, todos.len() as i64, &[]);
    category_count.observe(&cx, categories.len() as i64, &[]);
    telemetry.metrics_handler().call(request).await
}
The telemetry variable is used to retrieve the PrometheusMetricsHandler instance. The db variable is used to get access to the Database instance.
I created two new metrics, todo_count and category_count, that are used to count the number of todos and categories as a gauge.
A gauge is a metric that represents a single numerical value that can increase or decrease.
In the end, the PrometheusMetricsHandler instance is called to handle exposing the additional metrics to Prometheus.
Testing the application
Now with everything in place, we can start the application and test it. But before we do that, let us take care that we have a Jaeger and Prometheus instance running. For this, I created a new docker-compose file called telemetry.yaml:
version: '3.8'

services:
  jaeger:
    image: jaegertracing/all-in-one:1.43.0
    ports:
      - "16686:16686"
      - "14268:14268"
      - "9411:9411"
      - "5778:5778"
      - "6831:6831/udp"
      - "6832:6832/udp"
      - "5775:5775/udp"
    environment:
      - COLLECTOR_ZIPKIN_HTTP_PORT=9411

  prometheus:
    image: prom/prometheus:v2.43.0
    ports:
      - "9090:9090"
    volumes:
      - ./prometheus.yaml:/etc/prometheus/prometheus.yml
And the corresponding prometheus.yaml file, so that Prometheus can scrape the metrics from the Actix application running currently on localhost:8080:
global:
  scrape_interval: 5s # How frequently to scrape targets by default
  evaluation_interval: 5s # How frequently to evaluate rules by default

scrape_configs:
  - job_name: 'demo'
    static_configs:
      - targets: [ 'host.docker.internal:8080' ] # The host.docker.internal is a special DNS name that resolves to the internal IP address used by the host.
        labels:
          group: 'demo'
Now we can start the application and Prometheus:
docker-compose -f telemetry.yaml up -d
And you can access the Jaeger UI at http://localhost:16686 and Prometheus at http://localhost:9090.
Finally, we can start the application:
cargo run
Check the /metrics endpoint:
curl http://localhost:8080/metrics
You should see the following output:
# HELP category_count Number of categories
# TYPE category_count gauge
category_count{service_name="unknown_service"} 5
# HELP http_server_active_requests HTTP concurrent in-flight requests per route
# TYPE http_server_active_requests gauge
http_server_active_requests{http_flavor="HTTP/1.1",http_host="host.docker.internal:8080",http_method="GET",http_scheme="http",http_server_name="127.0.0.1:8080",http_target="/metrics",net_host_port="8080",service_name="unknown_service"} 1
# HELP http_server_duration HTTP inbound request duration per route
# TYPE http_server_duration histogram
http_server_duration_bucket{http_flavor="HTTP/1.1",http_host="host.docker.internal:8080",http_method="GET",http_scheme="http",http_server_name="127.0.0.1:8080",http_status_code="200",http_target="/metrics",net_host_port="8080",service_name="unknown_service",le="0.1"} 0
http_server_duration_bucket{http_flavor="HTTP/1.1",http_host="host.docker.internal:8080",http_method="GET",http_scheme="http",http_server_name="127.0.0.1:8080",http_status_code="200",http_target="/metrics",net_host_port="8080",service_name="unknown_service",le="0.5"} 0
http_server_duration_bucket{http_flavor="HTTP/1.1",http_host="host.docker.internal:8080",http_method="GET",http_scheme="http",http_server_name="127.0.0.1:8080",http_status_code="200",http_target="/metrics",net_host_port="8080",service_name="unknown_service",le="1"} 0
http_server_duration_bucket{http_flavor="HTTP/1.1",http_host="host.docker.internal:8080",http_method="GET",http_scheme="http",http_server_name="127.0.0.1:8080",http_status_code="200",http_target="/metrics",net_host_port="8080",service_name="unknown_service",le="2"} 0
http_server_duration_bucket{http_flavor="HTTP/1.1",http_host="host.docker.internal:8080",http_method="GET",http_scheme="http",http_server_name="127.0.0.1:8080",http_status_code="200",http_target="/metrics",net_host_port="8080",service_name="unknown_service",le="5"} 3
http_server_duration_bucket{http_flavor="HTTP/1.1",http_host="host.docker.internal:8080",http_method="GET",http_scheme="http",http_server_name="127.0.0.1:8080",http_status_code="200",http_target="/metrics",net_host_port="8080",service_name="unknown_service",le="10"} 5
http_server_duration_bucket{http_flavor="HTTP/1.1",http_host="host.docker.internal:8080",http_method="GET",http_scheme="http",http_server_name="127.0.0.1:8080",http_status_code="200",http_target="/metrics",net_host_port="8080",service_name="unknown_service",le="+Inf"} 6
http_server_duration_sum{http_flavor="HTTP/1.1",http_host="host.docker.internal:8080",http_method="GET",http_scheme="http",http_server_name="127.0.0.1:8080",http_status_code="200",http_target="/metrics",net_host_port="8080",service_name="unknown_service"} 36.187
http_server_duration_count{http_flavor="HTTP/1.1",http_host="host.docker.internal:8080",http_method="GET",http_scheme="http",http_server_name="127.0.0.1:8080",http_status_code="200",http_target="/metrics",net_host_port="8080",service_name="unknown_service"} 6
# HELP todo_count Number of todos
# TYPE todo_count gauge
todo_count{service_name="unknown_service"} 0
As you can see, we have a few metrics that are being collected by default. We can also see that the category_count metric is being collected, and it has a value of 5. This is because we initialized the database with 5 categories.
the todo_count metric is being collected, and it has a value of 0. This is because we haven't created any todos yet.
Let us create some todos, one for each category:
curl -s -X POST -H "Content-Type: application/json" -d '{"title": "Prepare presentation slides", "description": "Create slides for the upcoming project meeting", "category_id": 1}' http://localhost:8080/api/todos | jq
curl -s -X POST -H "Content-Type: application/json" -d '{"title": "Buy groceries", "description": "Purchase groceries for the week", "category_id": 2}' http://localhost:8080/api/todos | jq
curl -s -X POST -H "Content-Type: application/json" -d '{"title": "Run 5 miles", "description": "Complete a 5-mile run for weekly exercise", "category_id": 3}' http://localhost:8080/api/todos | jq
curl -s -X POST -H "Content-Type: application/json" -d '{"title": "Practice guitar", "description": "Spend 30 minutes practicing guitar chords", "category_id": 4}' http://localhost:8080/api/todos | jq
curl -s -X POST -H "Content-Type: application/json" -d '{"title": "Study for the exam", "description": "Review course material for the upcoming exam", "category_id": 5}' http://localhost:8080/api/todos | jq

{
  "id": "55aff8a6-42c2-4d94-8872-b94a55beae08",
  "title": "Prepare presentation slides",
  "description": "Create slides for the upcoming project meeting",
  "created_at": "2023-04-04T09:40:07.581186",
  "updated_at": "2023-04-04T09:40:07.581199",
  "category_id": 1
}
{
  "id": "e10567cb-c1df-413a-8996-6c072e124a0c",
  "title": "Buy groceries",
  "description": "Purchase groceries for the week",
  "created_at": "2023-04-04T09:40:07.604805",
  "updated_at": "2023-04-04T09:40:07.604809",
  "category_id": 2
}
{
  "id": "4f0bb9d3-fd24-4a51-b11e-1a12231a4529",
  "title": "Run 5 miles",
  "description": "Complete a 5-mile run for weekly exercise",
  "created_at": "2023-04-04T09:40:07.619386",
  "updated_at": "2023-04-04T09:40:07.619389",
  "category_id": 3
}
{
  "id": "055b7ab2-53d9-468b-a4ac-82e70d190a33",
  "title": "Practice guitar",
  "description": "Spend 30 minutes practicing guitar chords",
  "created_at": "2023-04-04T09:40:07.633674",
  "updated_at": "2023-04-04T09:40:07.633676",
  "category_id": 4
}
{
  "id": "b422a294-57f7-4c0c-bd67-9d7babf1bd9c",
  "title": "Study for the exam",
  "description": "Review course material for the upcoming exam",
  "created_at": "2023-04-04T09:40:07.649398",
  "updated_at": "2023-04-04T09:40:07.649401",
  "category_id": 5
}
Now, let's get all todos with the /api/todos endpoint:
curl -s http://127.0.0.1:8080/api/todos | jq
[
  {
    "id": "55aff8a6-42c2-4d94-8872-b94a55beae08",
    "title": "Prepare presentation slides",
    "description": "Create slides for the upcoming project meeting",
    "created_at": "2023-04-04T09:40:07.581186",
    "updated_at": "2023-04-04T09:40:07.581199",
    "category": {
      "id": 1,
      "name": "Work",
      "description": "Tasks related to work or job responsibilities"
    }
  },
  {
    "id": "e10567cb-c1df-413a-8996-6c072e124a0c",
    "title": "Buy groceries",
    "description": "Purchase groceries for the week",
    "created_at": "2023-04-04T09:40:07.604805",
    "updated_at": "2023-04-04T09:40:07.604809",
    "category": {
      "id": 2,
      "name": "Personal",
      "description": "Personal tasks and errands"
    }
  },
  {
    "id": "4f0bb9d3-fd24-4a51-b11e-1a12231a4529",
    "title": "Run 5 miles",
    "description": "Complete a 5-mile run for weekly exercise",
    "created_at": "2023-04-04T09:40:07.619386",
    "updated_at": "2023-04-04T09:40:07.619389",
    "category": {
      "id": 3,
      "name": "Health",
      "description": "Health and fitness related tasks"
    }
  },
  {
    "id": "055b7ab2-53d9-468b-a4ac-82e70d190a33",
    "title": "Practice guitar",
    "description": "Spend 30 minutes practicing guitar chords",
    "created_at": "2023-04-04T09:40:07.633674",
    "updated_at": "2023-04-04T09:40:07.633676",
    "category": {
      "id": 4,
      "name": "Hobbies",
      "description": "Tasks related to hobbies and interests"
    }
  },
  {
    "id": "b422a294-57f7-4c0c-bd67-9d7babf1bd9c",
    "title": "Study for the exam",
    "description": "Review course material for the upcoming exam",
    "created_at": "2023-04-04T09:40:07.649398",
    "updated_at": "2023-04-04T09:40:07.649401",
    "category": {
      "id": 5,
      "name": "Education",
      "description": "Tasks related to learning and education"
    }
  }
]
And check the /metrics endpoint:
# HELP category_count Number of categories
# TYPE category_count gauge
category_count{service_name="unknown_service"} 5

# omitted for brevity

# HELP todo_count Number of todos
# TYPE todo_count gauge
todo_count{service_name="unknown_service"} 5
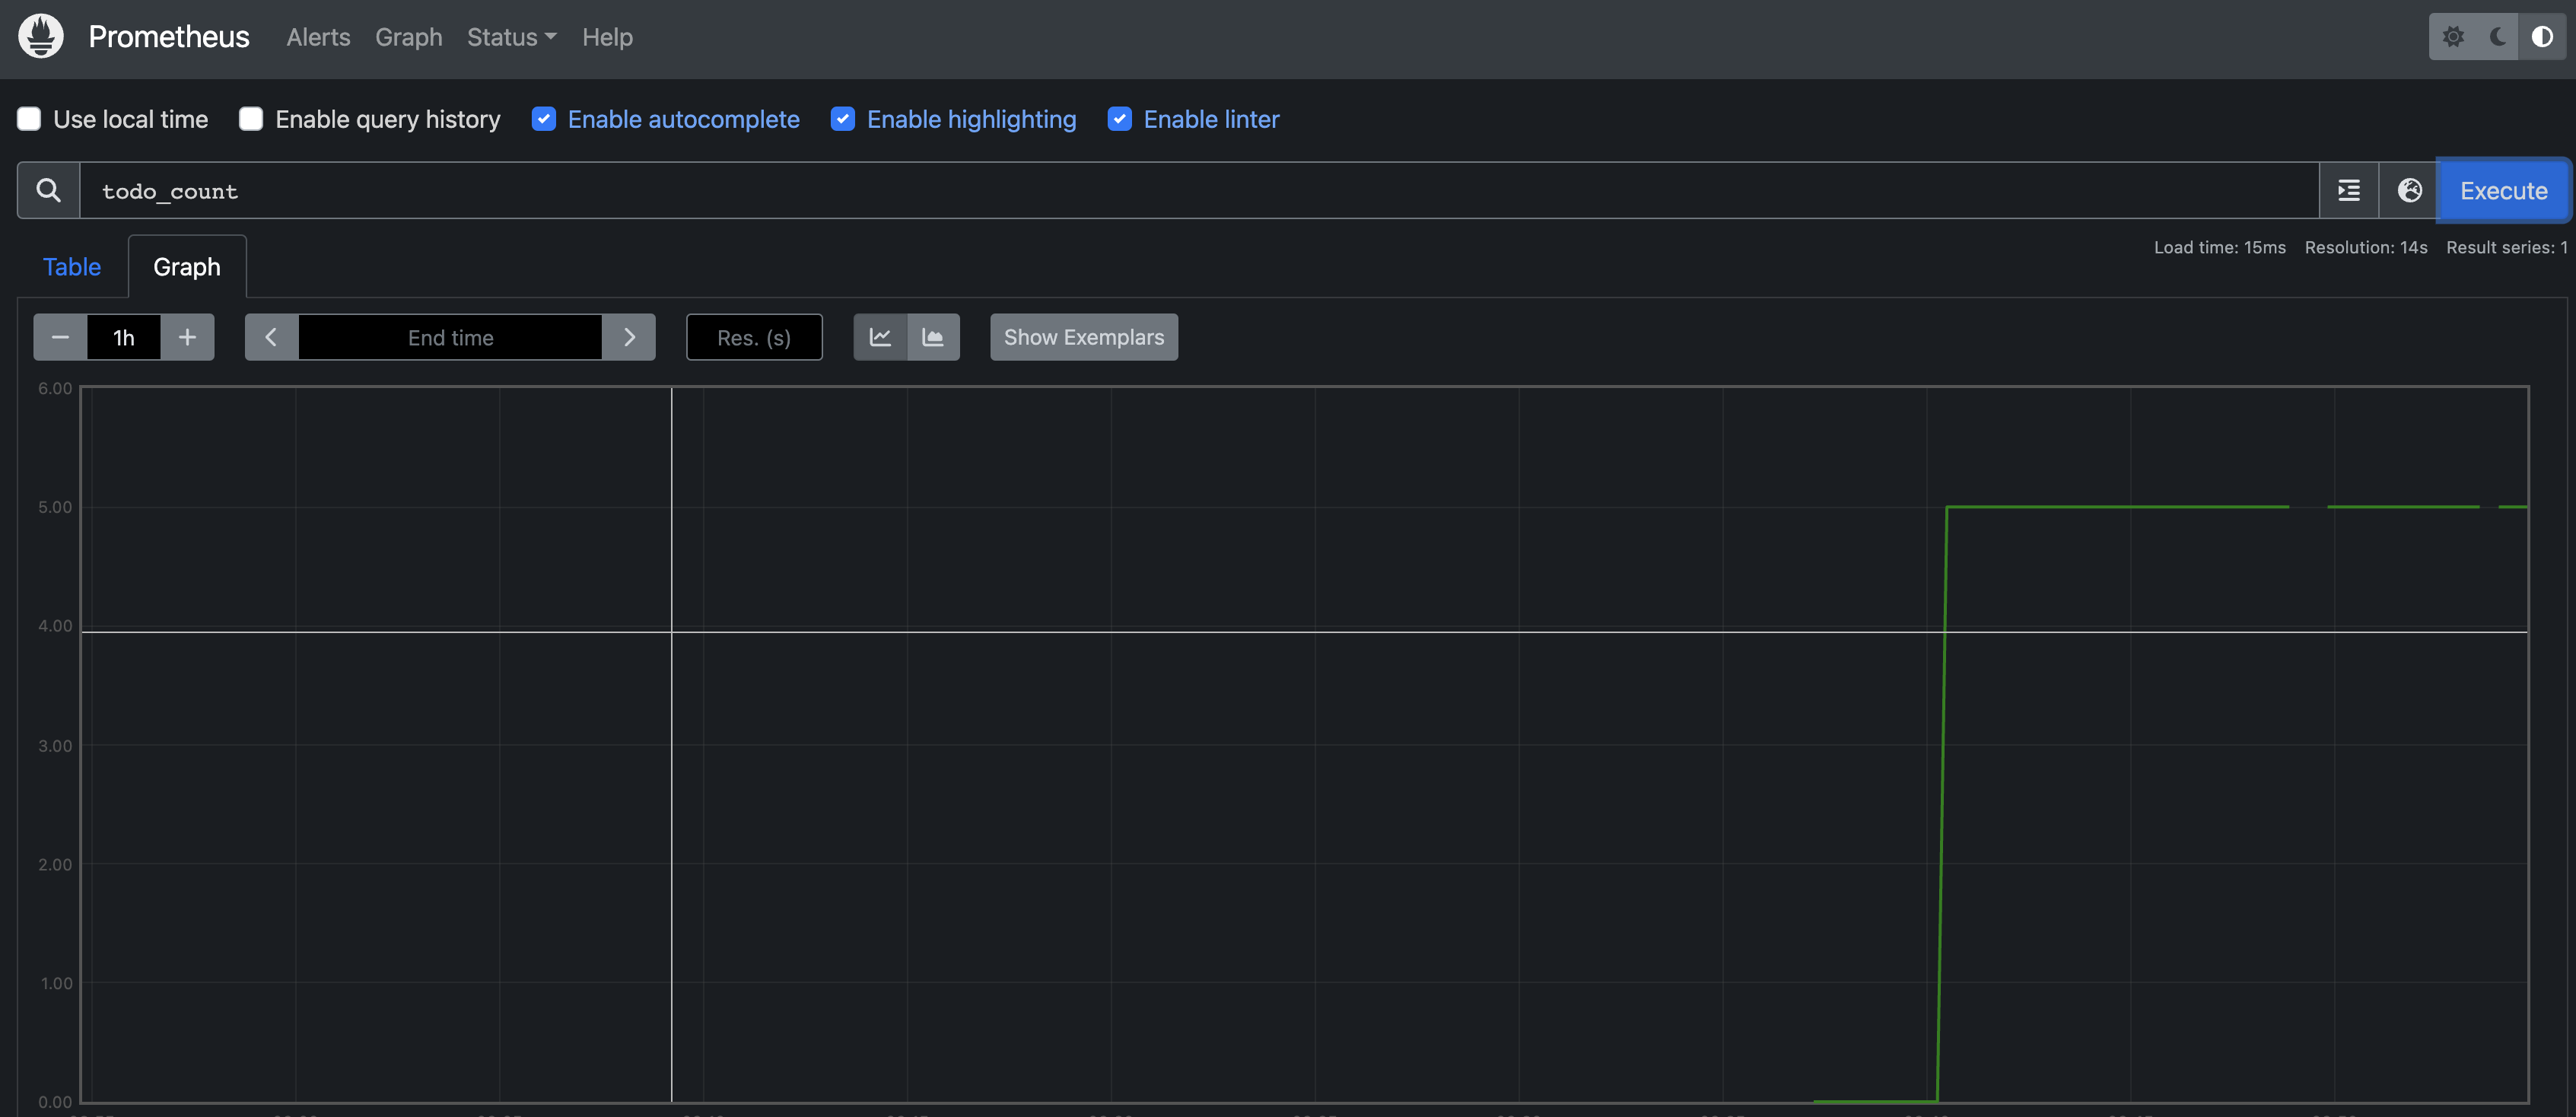
The todo_count metric is now showing the correct value of 5, as expected.
Head over to the UI of Prometheus and check the todo_count metric
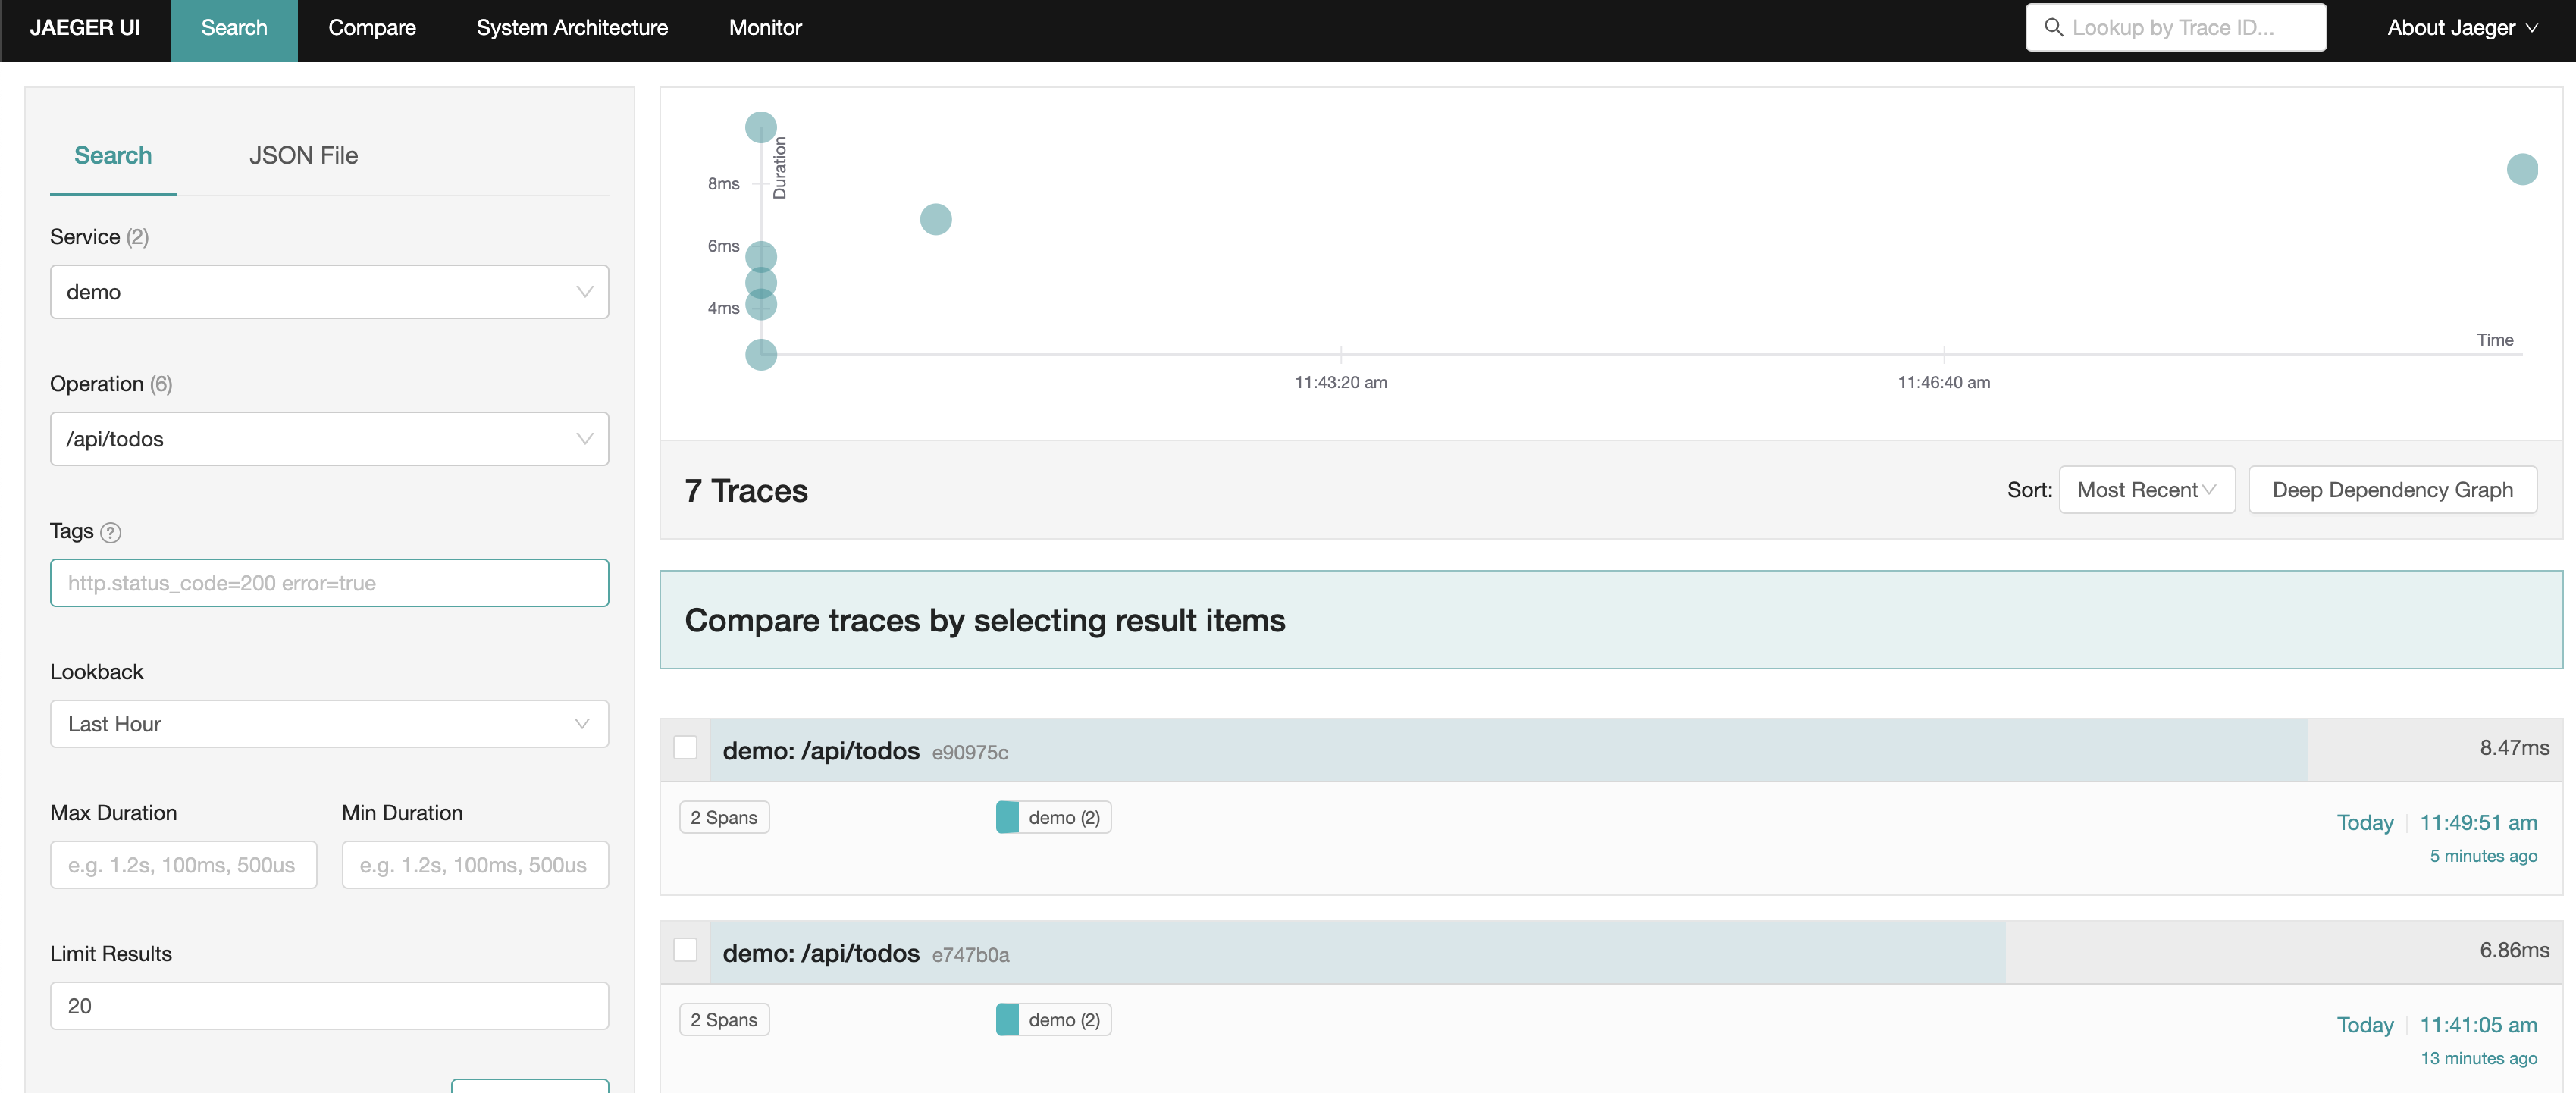
And same for the traces in the Jaeger UI
Housekeeping
To stop and remove the postgres container and volume, run the following commands:
docker-compose -f postgres.yaml down
docker volume rm rust-actix-web-rest-api-diesel_postgres-data
To stop the telemetry containers, run the following commands:
docker-compose -f telemetry.yaml down
Conclusion
Congrats! We, again, successfully added telemetry to our Rust Actix Web REST API demo application. We also configured Prometheus and Jaeger to collect and visualize the metrics and traces. And everything on top of our existing application code.