How to monitor Cilium on your Civo k3s cluster with Prometheus
Cloud Native Pilgrim | Kubernetes Enthusiast | Serverless Believer | Customer Experience Architect @ Pulumi | (he/him) | CK{A,AD} |
This article is a follow-up to How to enable the Cilium Hubble UI in a Civo k3s cluster
TL;DR: Code
Deploy the kube-prometheus-stack via Pulumi
The deployment of the
kube-prometheus-stackis not production-ready, please keep this in mind.
To enable the monitoring on our Civo k3s cluster, we add the following lines to our Pulumi program:
  k8s-provider:
    type: pulumi:providers:kubernetes
    properties:
      kubeconfig: ${civo-k3s-cluster.kubeconfig}
      enableServerSideApply: true

  monitoring-namespace:
    type: kubernetes:core/v1:Namespace
    properties:
      metadata:
        name: monitoring
    options:
      provider: ${k8s-provider}

  kube-prometheus-stack:
    type: kubernetes:helm.sh/v3:Release
    properties:
      namespace: ${monitoring-namespace.metadata.name}
      chart: kube-prometheus-stack
      version: ${kube-prometheus-version}
      repositoryOpts:
        repo: https://prometheus-community.github.io/helm-charts
      values:
        prometheus:
          prometheusSpec:
            serviceMonitorSelectorNilUsesHelmValues: false
    options:
      provider: ${k8s-provider}
This code will install the kube-prometheus-stack helm chart on our Civo k3s cluster.
The Pulumi k8s provider uses the kubeconfig from the cilium-k3s-cluster resource as input. On top we enable the new Pulumi feature of server-side apply by setting the enableServerSideApply property to true.
We need to set the prometheus.prometheusSpec.serviceMonitorSelectorNilUsesHelmValues to false. By default, Prometheus discovers PodMonitors and ServiceMonitors? within its namespace but with setting this property tofalse, we enable Prometheus to discover allPodMonitors/ServiceMonitors` in the cluster.
Now we can deploy our Pulumi program with the following command:
export CIVO_TOKEN=xxxx
pulumi up -y -f

Updating (dev)

View Live: https://app.pulumi.com/dirien/pulumi-civo-cilium-prometheus/dev/updates/8

     Type                              Name                               Status
 +   pulumi:pulumi:Stack               pulumi-civo-cilium-prometheus-dev  created
 +   ├─ civo:index:Firewall            civo-firewall                      created
 +   ├─ civo:index:KubernetesCluster   civo-k3s-cluster                   created
 +   ├─ pulumi:providers:kubernetes    k8s-provider                       created
 +   ├─ kubernetes:core/v1:Namespace   monitoring-namespace               created
 +   └─ kubernetes:helm.sh/v3:Release  kube-prometheus-stack              created

Outputs:
    kubeconfig: [secret]

Resources:
    + 6 created

Duration: 3m24s
Grab the kubeconfig with the following command:
pulumi stack output kubeconfig --show-secrets > kubeconfig.yaml
And let us check the status of Cilium using the Cilium CLI
I installed the Cilium CLI via homebrew
brew install cilium-cli
cilium status
    /¯¯\
 /¯¯\__/¯¯\    Cilium:         OK
 \__/¯¯\__/    Operator:       OK
 /¯¯\__/¯¯\    Hubble:         disabled
 \__/¯¯\__/    ClusterMesh:    disabled
    \__/

DaemonSet         cilium             Desired: 2, Ready: 2/2, Available: 2/2
Deployment        cilium-operator    Desired: 2, Ready: 2/2, Available: 2/2
Containers:       cilium             Running: 2
                  cilium-operator    Running: 2
Cluster Pods:     7/7 managed by Cilium
Image versions    cilium             quay.io/cilium/cilium:v1.11.7@sha256:66a6f72a49e55e21278d07a99ff2cffa7565ed07f2578d54b5a92c1a492a6597: 2
                  cilium-operator    quay.io/cilium/operator-generic:v1.11.7@sha256:0f8ed5d815873d20848a360df3f2ebbd4116481ff817d3f295557801e0b45900: 2
And with k9s:
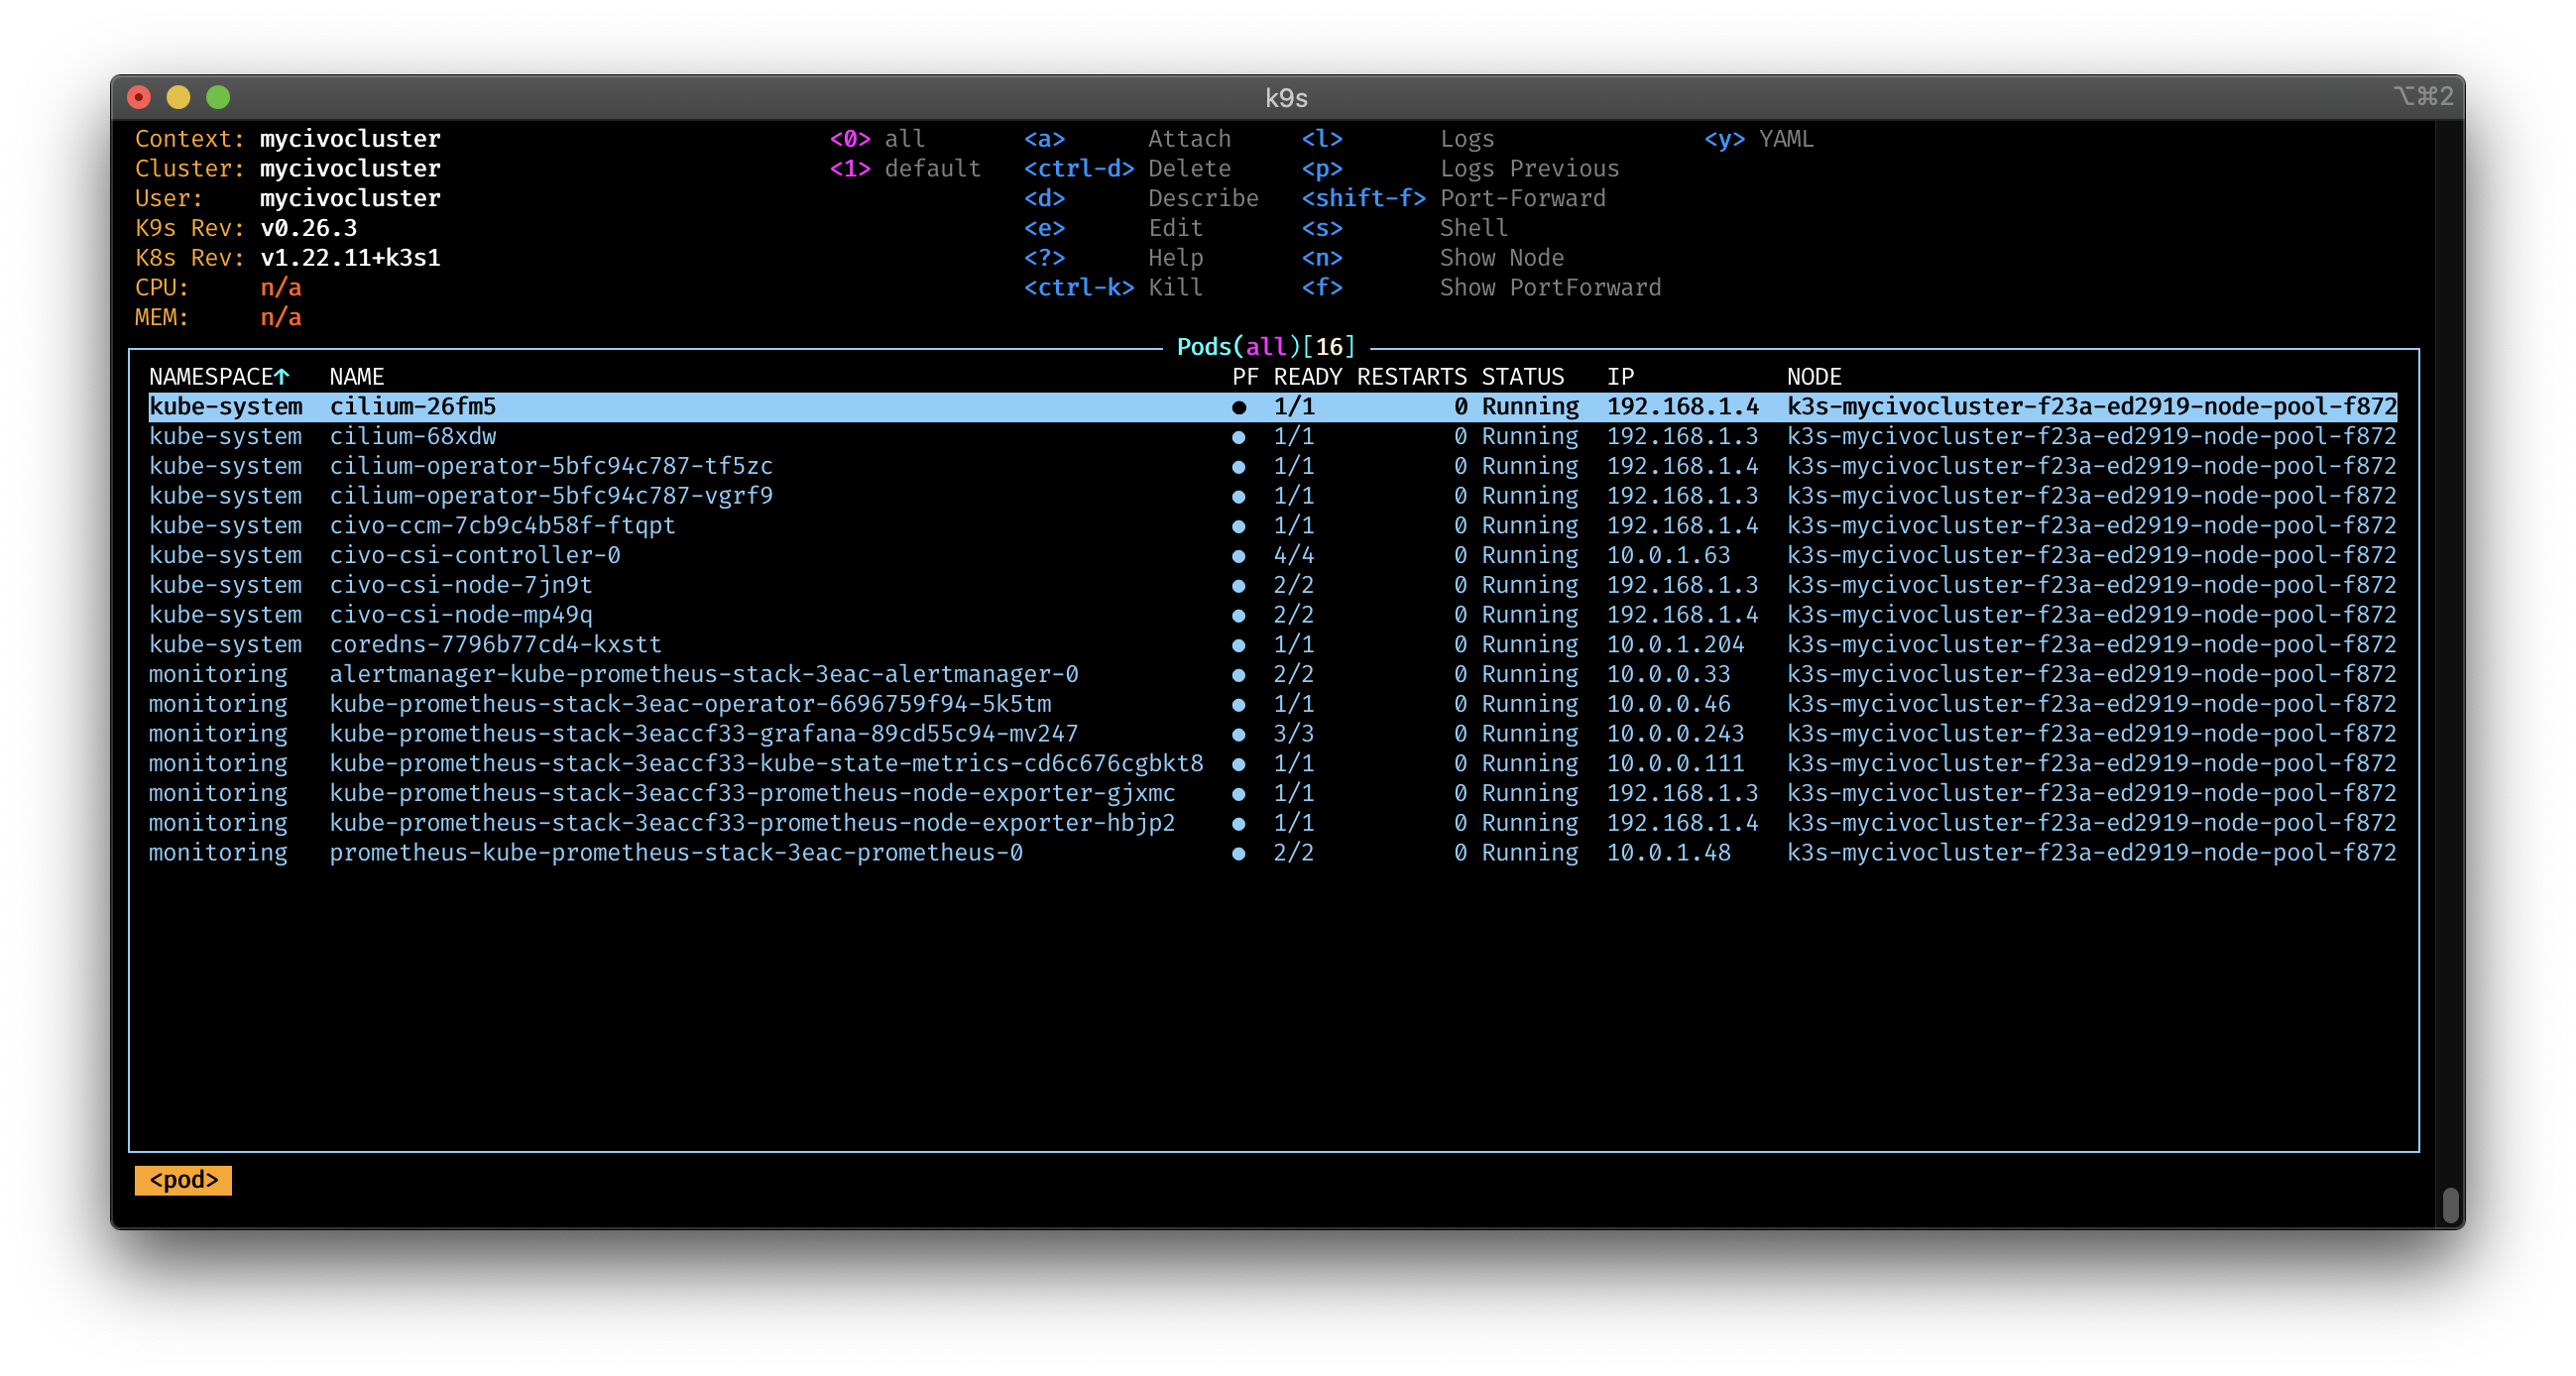
Check my article about k9s, if you want to get the most out of it!
Enable Cilium monitoring via Helm
Everything is up and running. Now we're going to enable the metrics and serviceMonitors in the Cilium deployment. Like in the last article, we need to update the helm release. For this I created a cilium.yaml file with all the values I am going to use.
hubble:
  metrics:
    enabled:
      - dns
      - drop
      - tcp
      - flow
      - port-distribution
      - icmp
      - http
    serviceMonitor:
      enabled: true
  tls:
    enabled: false
  relay:
    enabled: true
  ui:
    enabled: true

prometheus:
  enabled: true
  serviceMonitor:
    enabled: true

operator:
  prometheus:
    enabled: true
    serviceMonitor:
      enabled: true
We use the Helm CLI to update the cilium helm release using the -f flag to specify the cilium.yaml file.
helm upgrade cilium cilium/cilium --version 1.11.7 --namespace kube-system --reuse-values -f cilium.yaml
Re-check the status of Cilium:
cilium status
    /¯¯\
 /¯¯\__/¯¯\    Cilium:         OK
 \__/¯¯\__/    Operator:       OK
 /¯¯\__/¯¯\    Hubble:         OK
 \__/¯¯\__/    ClusterMesh:    disabled
    \__/

DaemonSet         cilium             Desired: 2, Ready: 2/2, Available: 2/2
Deployment        cilium-operator    Desired: 2, Ready: 2/2, Available: 2/2
Deployment        hubble-relay       Desired: 1, Ready: 1/1, Available: 1/1
Deployment        hubble-ui          Desired: 1, Ready: 1/1, Available: 1/1
Containers:       cilium             Running: 2
                  cilium-operator    Running: 2
                  hubble-relay       Running: 1
                  hubble-ui          Running: 1
Cluster Pods:     9/9 managed by Cilium
Image versions    hubble-ui          quay.io/cilium/hubble-ui:v0.9.0@sha256:0ef04e9a29212925da6bdfd0ba5b581765e41a01f1cc30563cef9b30b457fea0: 1
                  hubble-ui          quay.io/cilium/hubble-ui-backend:v0.9.0@sha256:000df6b76719f607a9edefb9af94dfd1811a6f1b6a8a9c537cba90bf12df474b: 1
                  cilium             quay.io/cilium/cilium:v1.11.7@sha256:66a6f72a49e55e21278d07a99ff2cffa7565ed07f2578d54b5a92c1a492a6597: 2
                  cilium-operator    quay.io/cilium/operator-generic:v1.11.7@sha256:0f8ed5d815873d20848a360df3f2ebbd4116481ff817d3f295557801e0b45900: 2
                  hubble-relay       quay.io/cilium/hubble-relay:v1.11.7@sha256:df6248b57528eadcf2fac6a27b47bad629ce1c868457a9a2e4835a47e0f18bd3: 1
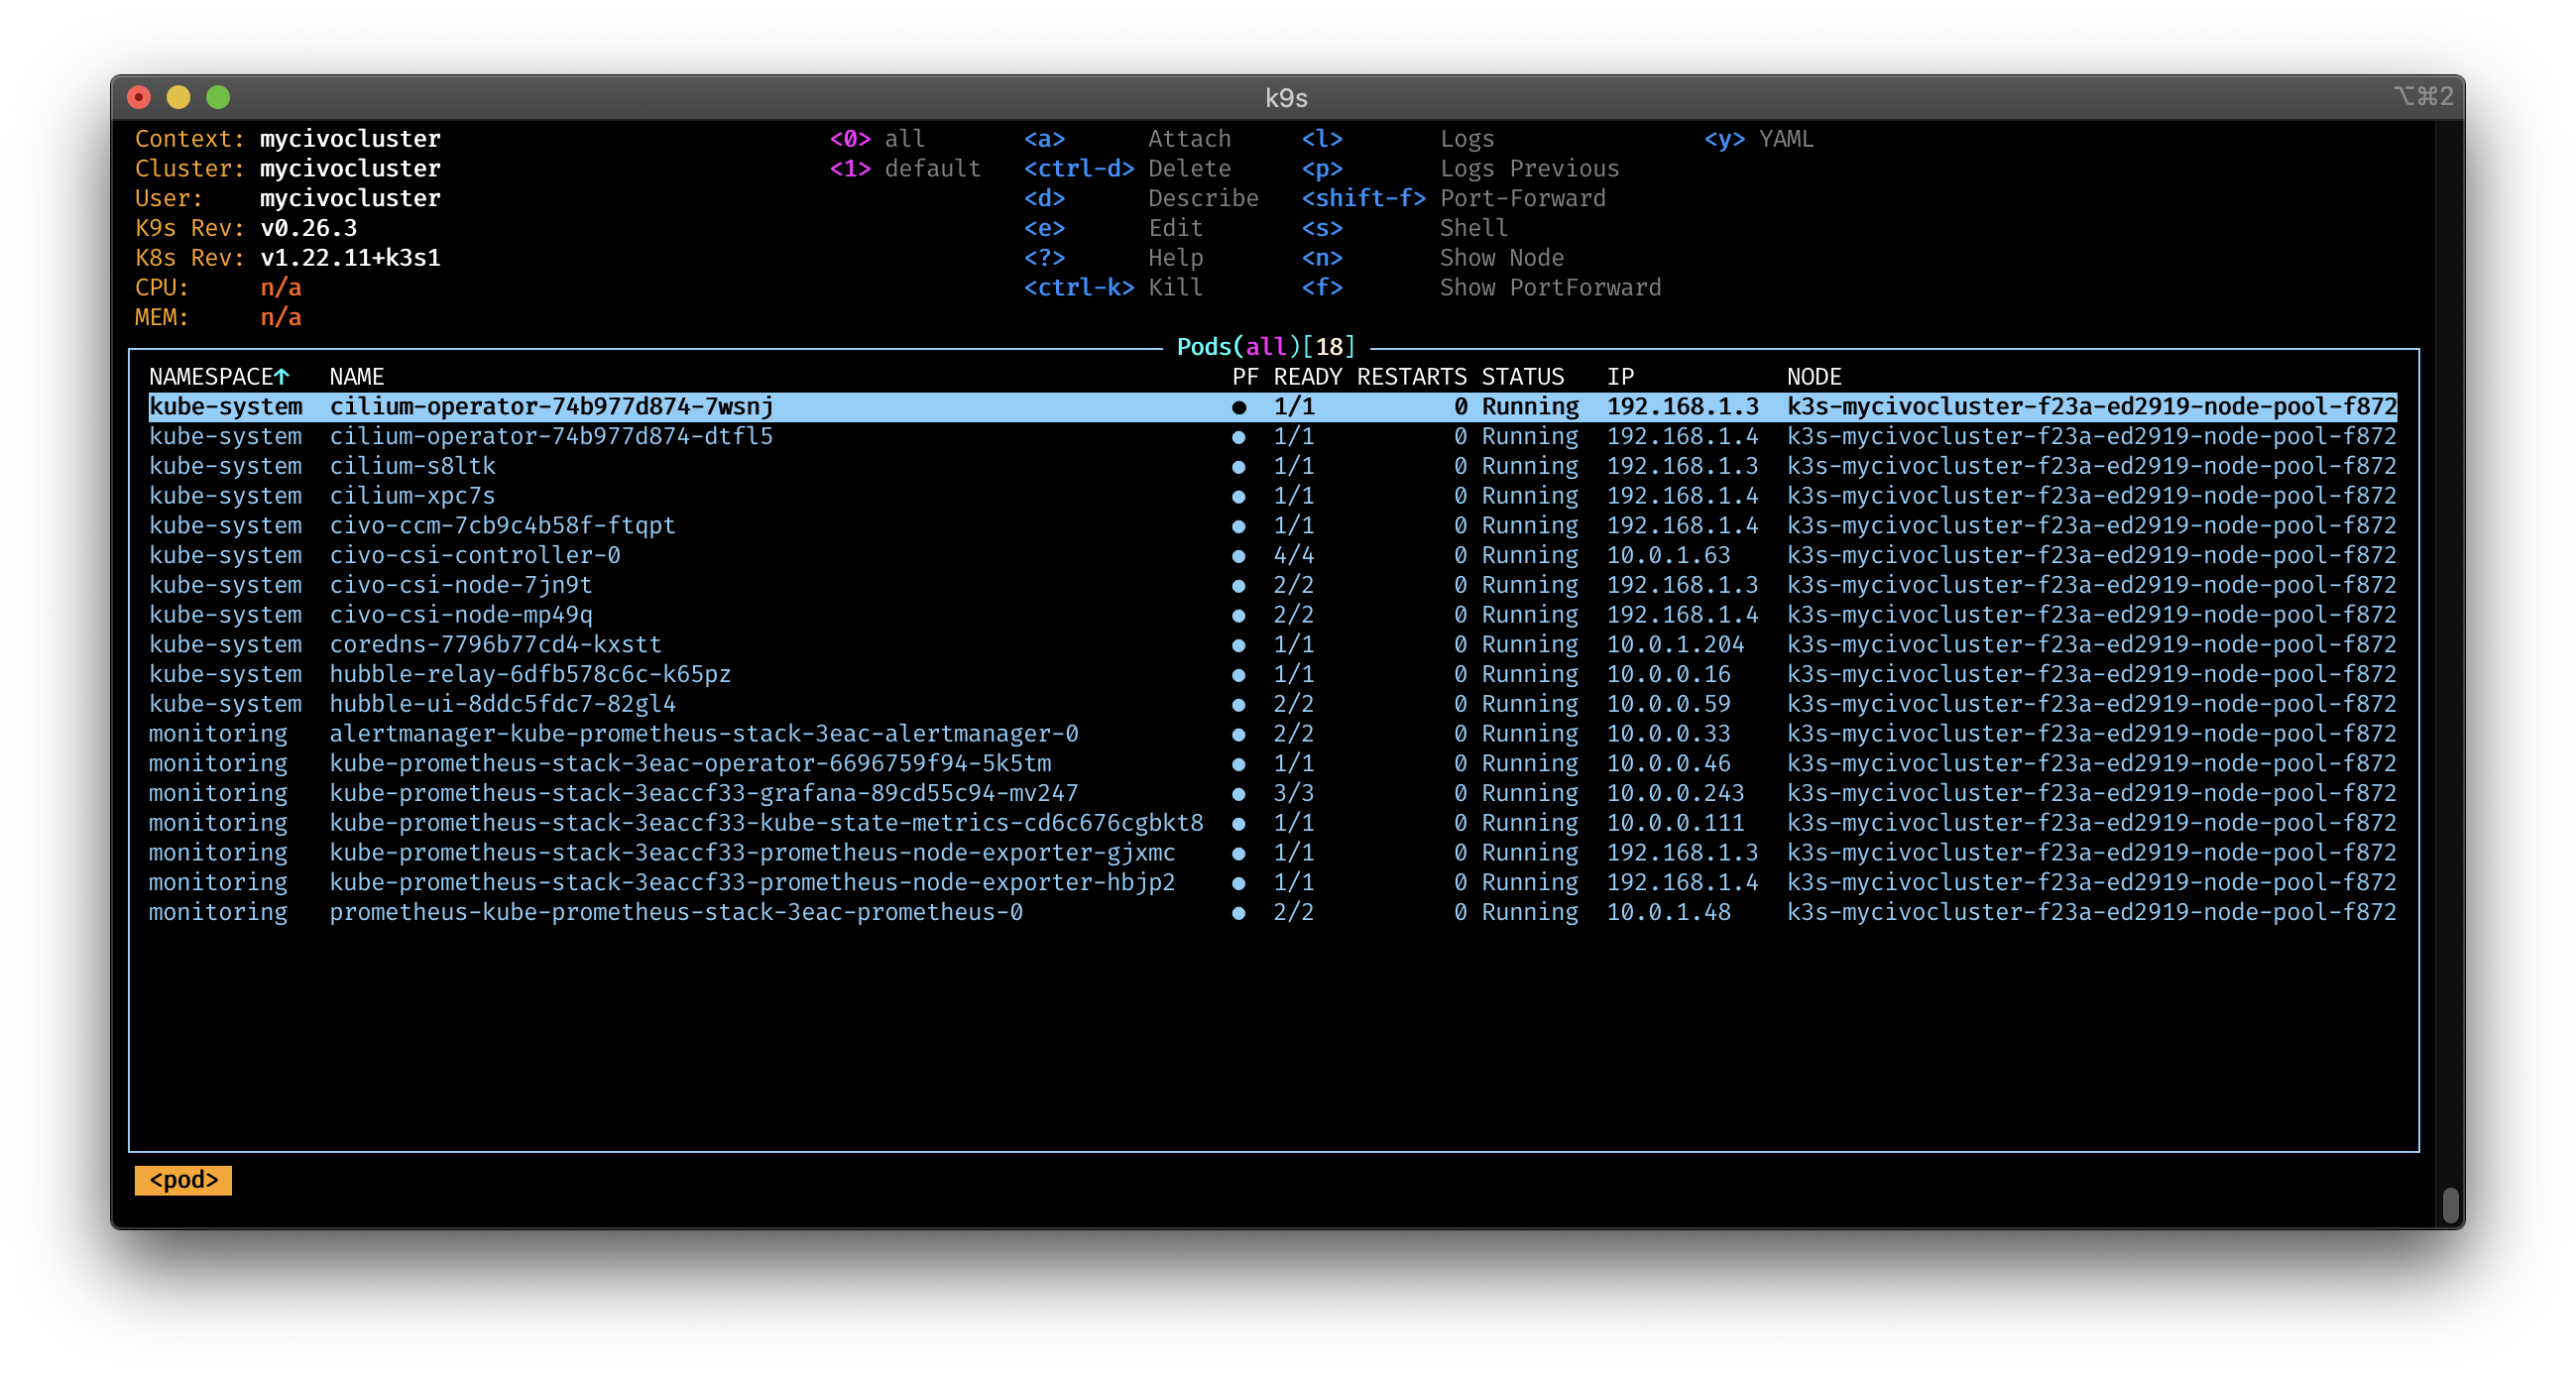
And with k9s:
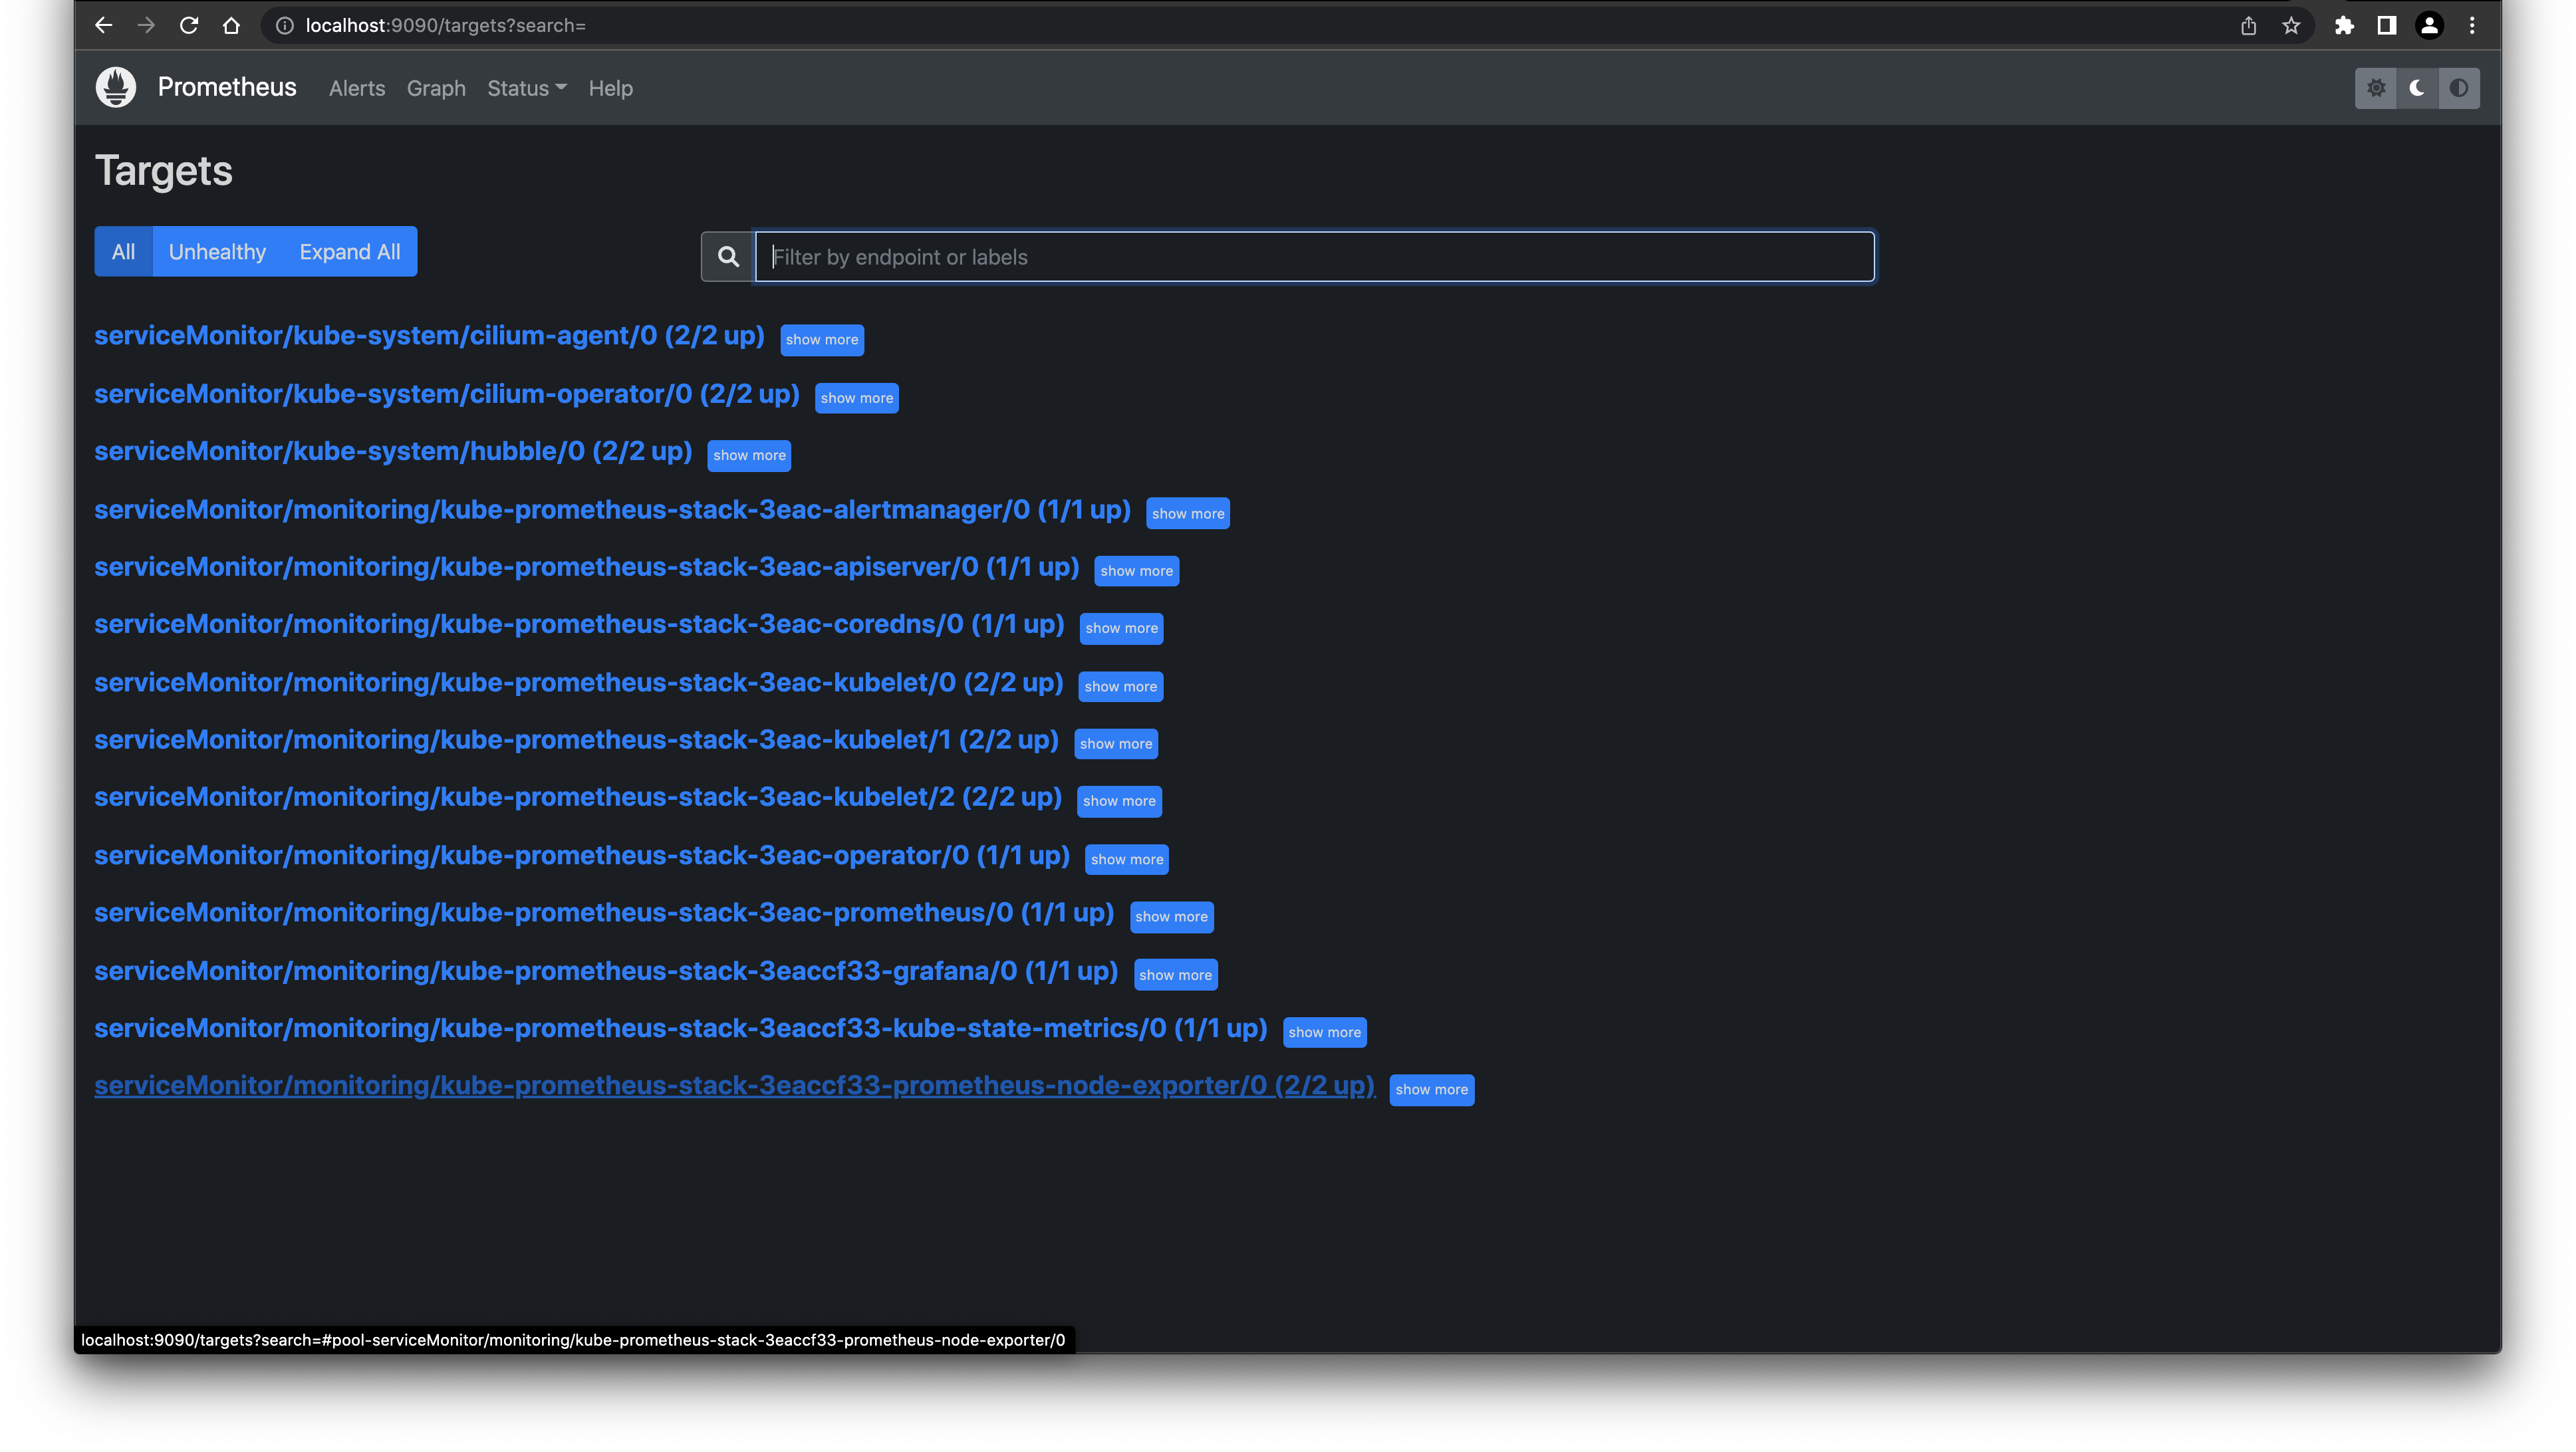
Now we can take a look in Prometheus to see if the ServiceMonitors are getting picked up. As I didn't define any Ingress I will use port-forward to access the Prometheus web interface.
kubectl port-forward svc/prometheus-operated 9090:9090 -n monitoring
Open a browser and type http://localhost:9000 to get the Prometheus web interface:
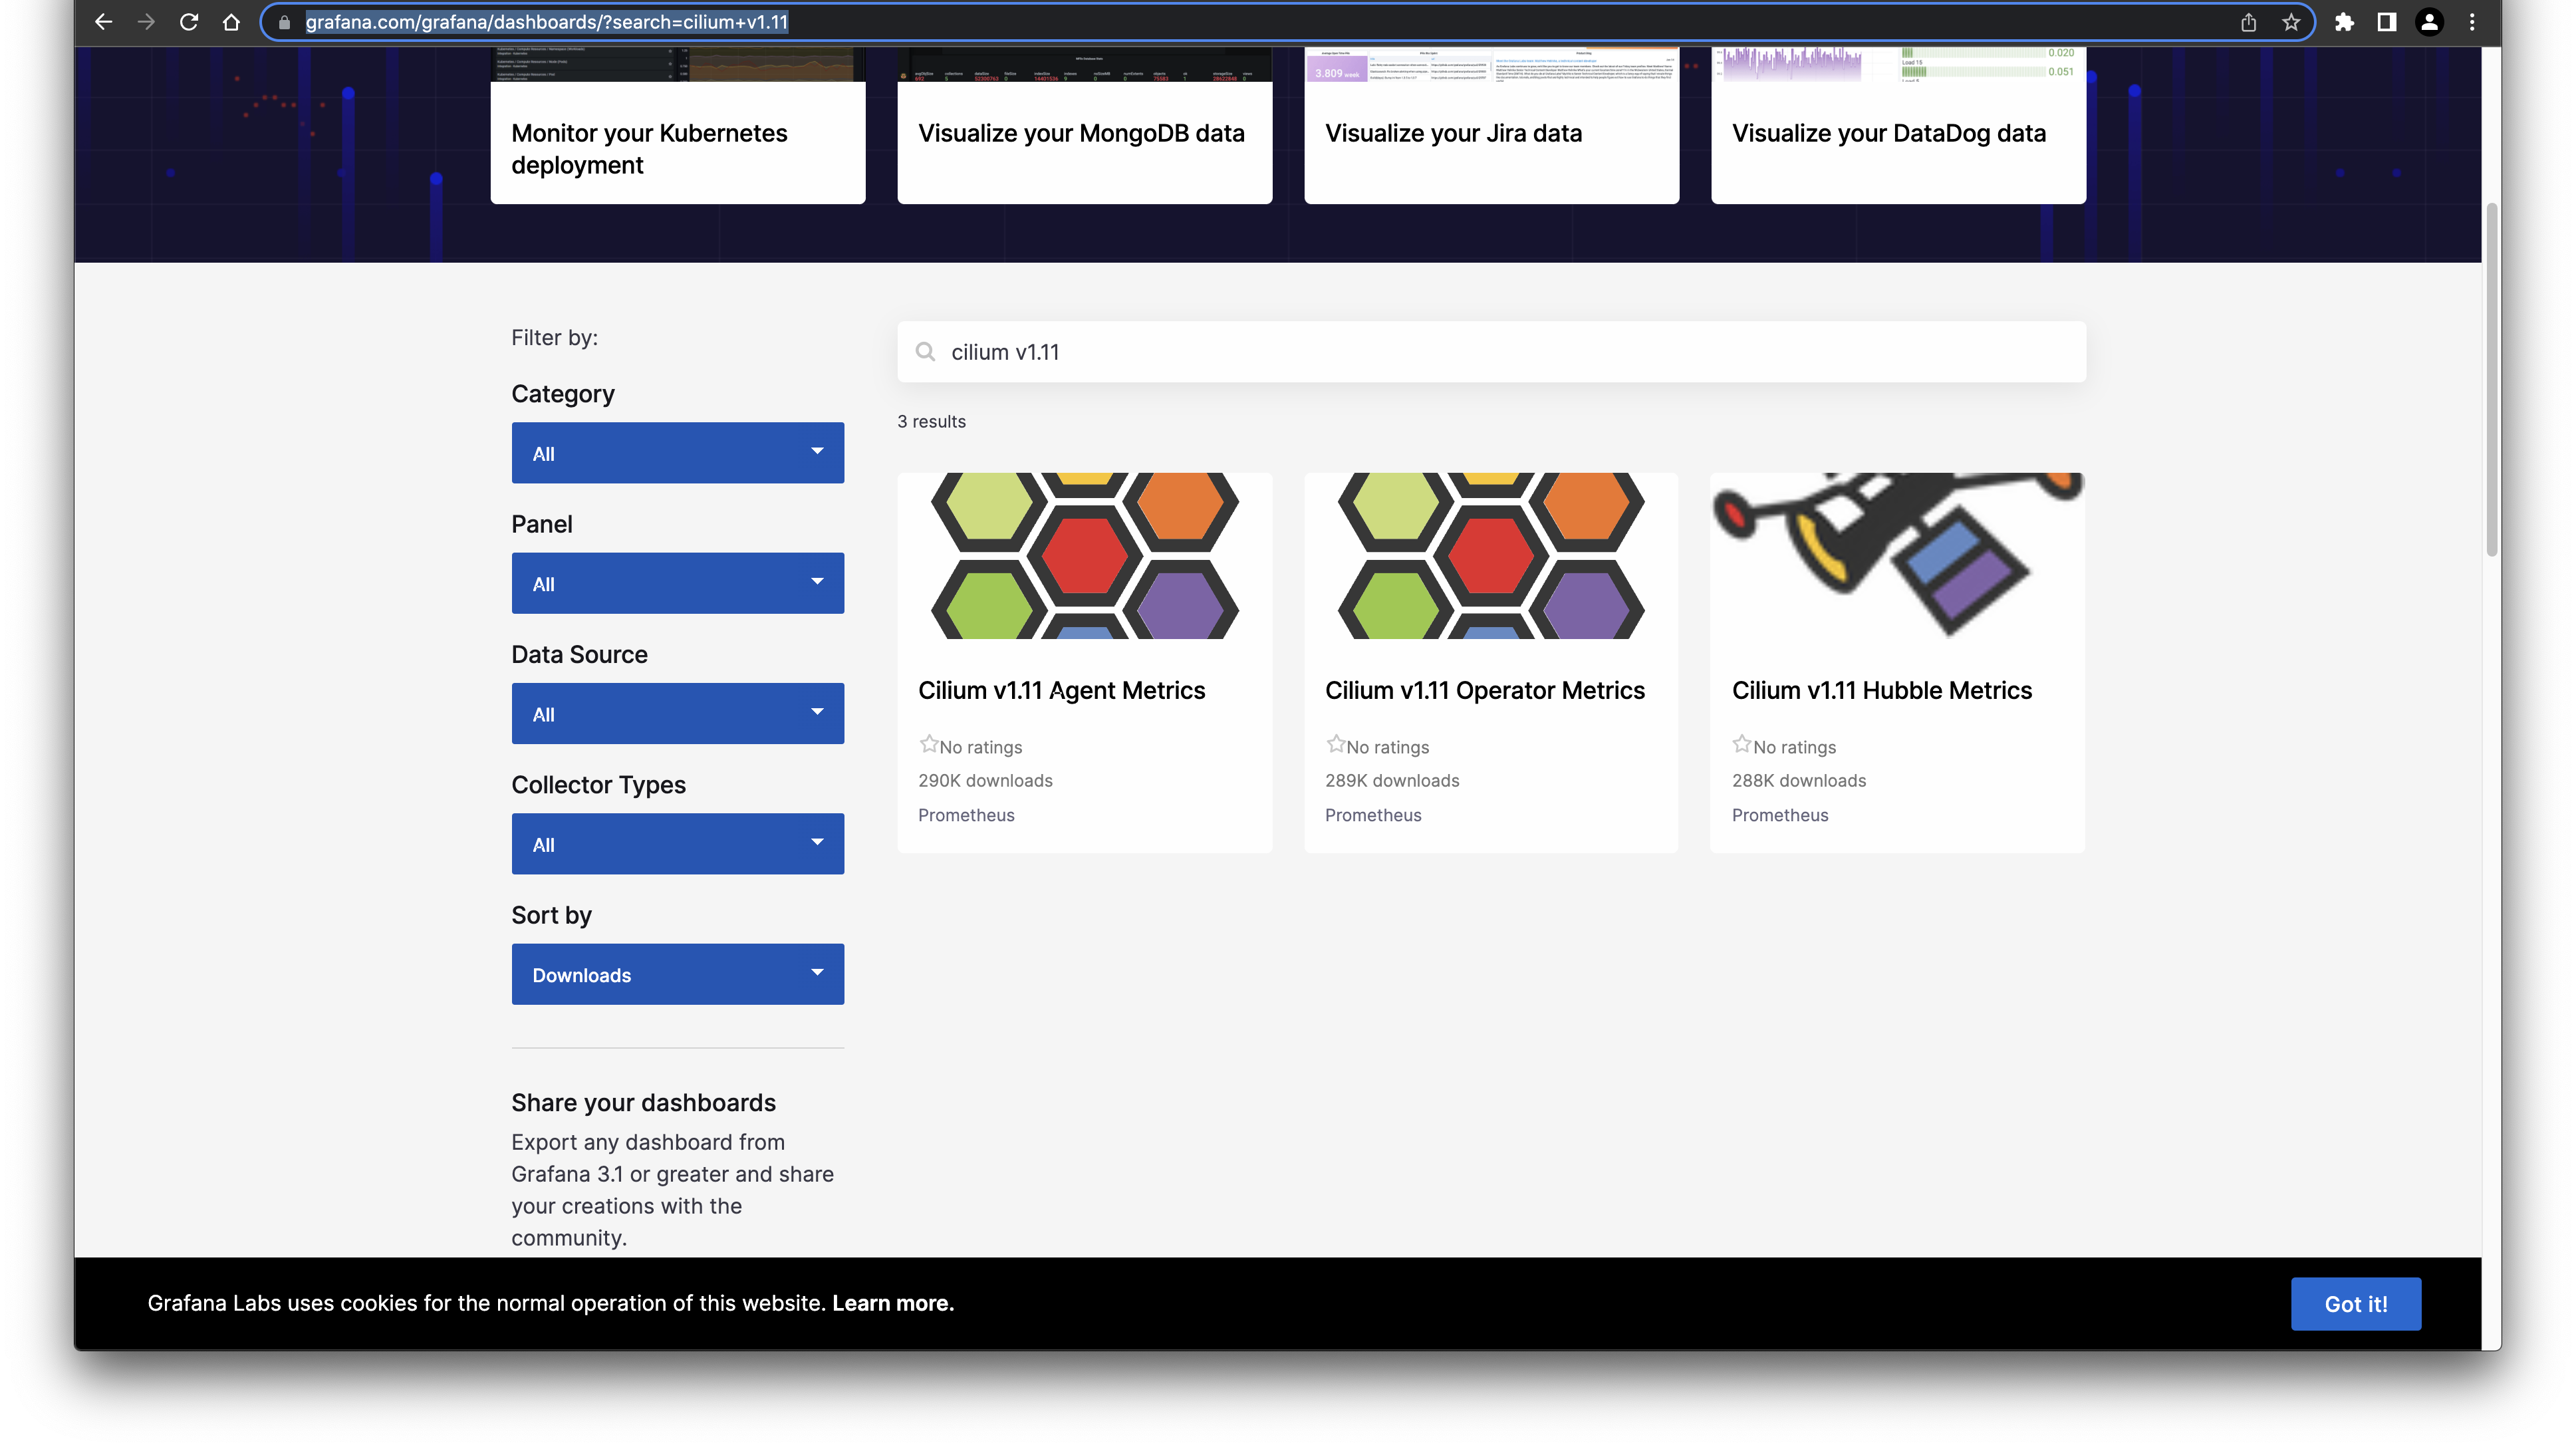
Import Cilium dashboards
Cilium is also offering predefined Grafana dashboards. You can download them on the Grafana website and import them via ID or JSON into your Grafana instance.
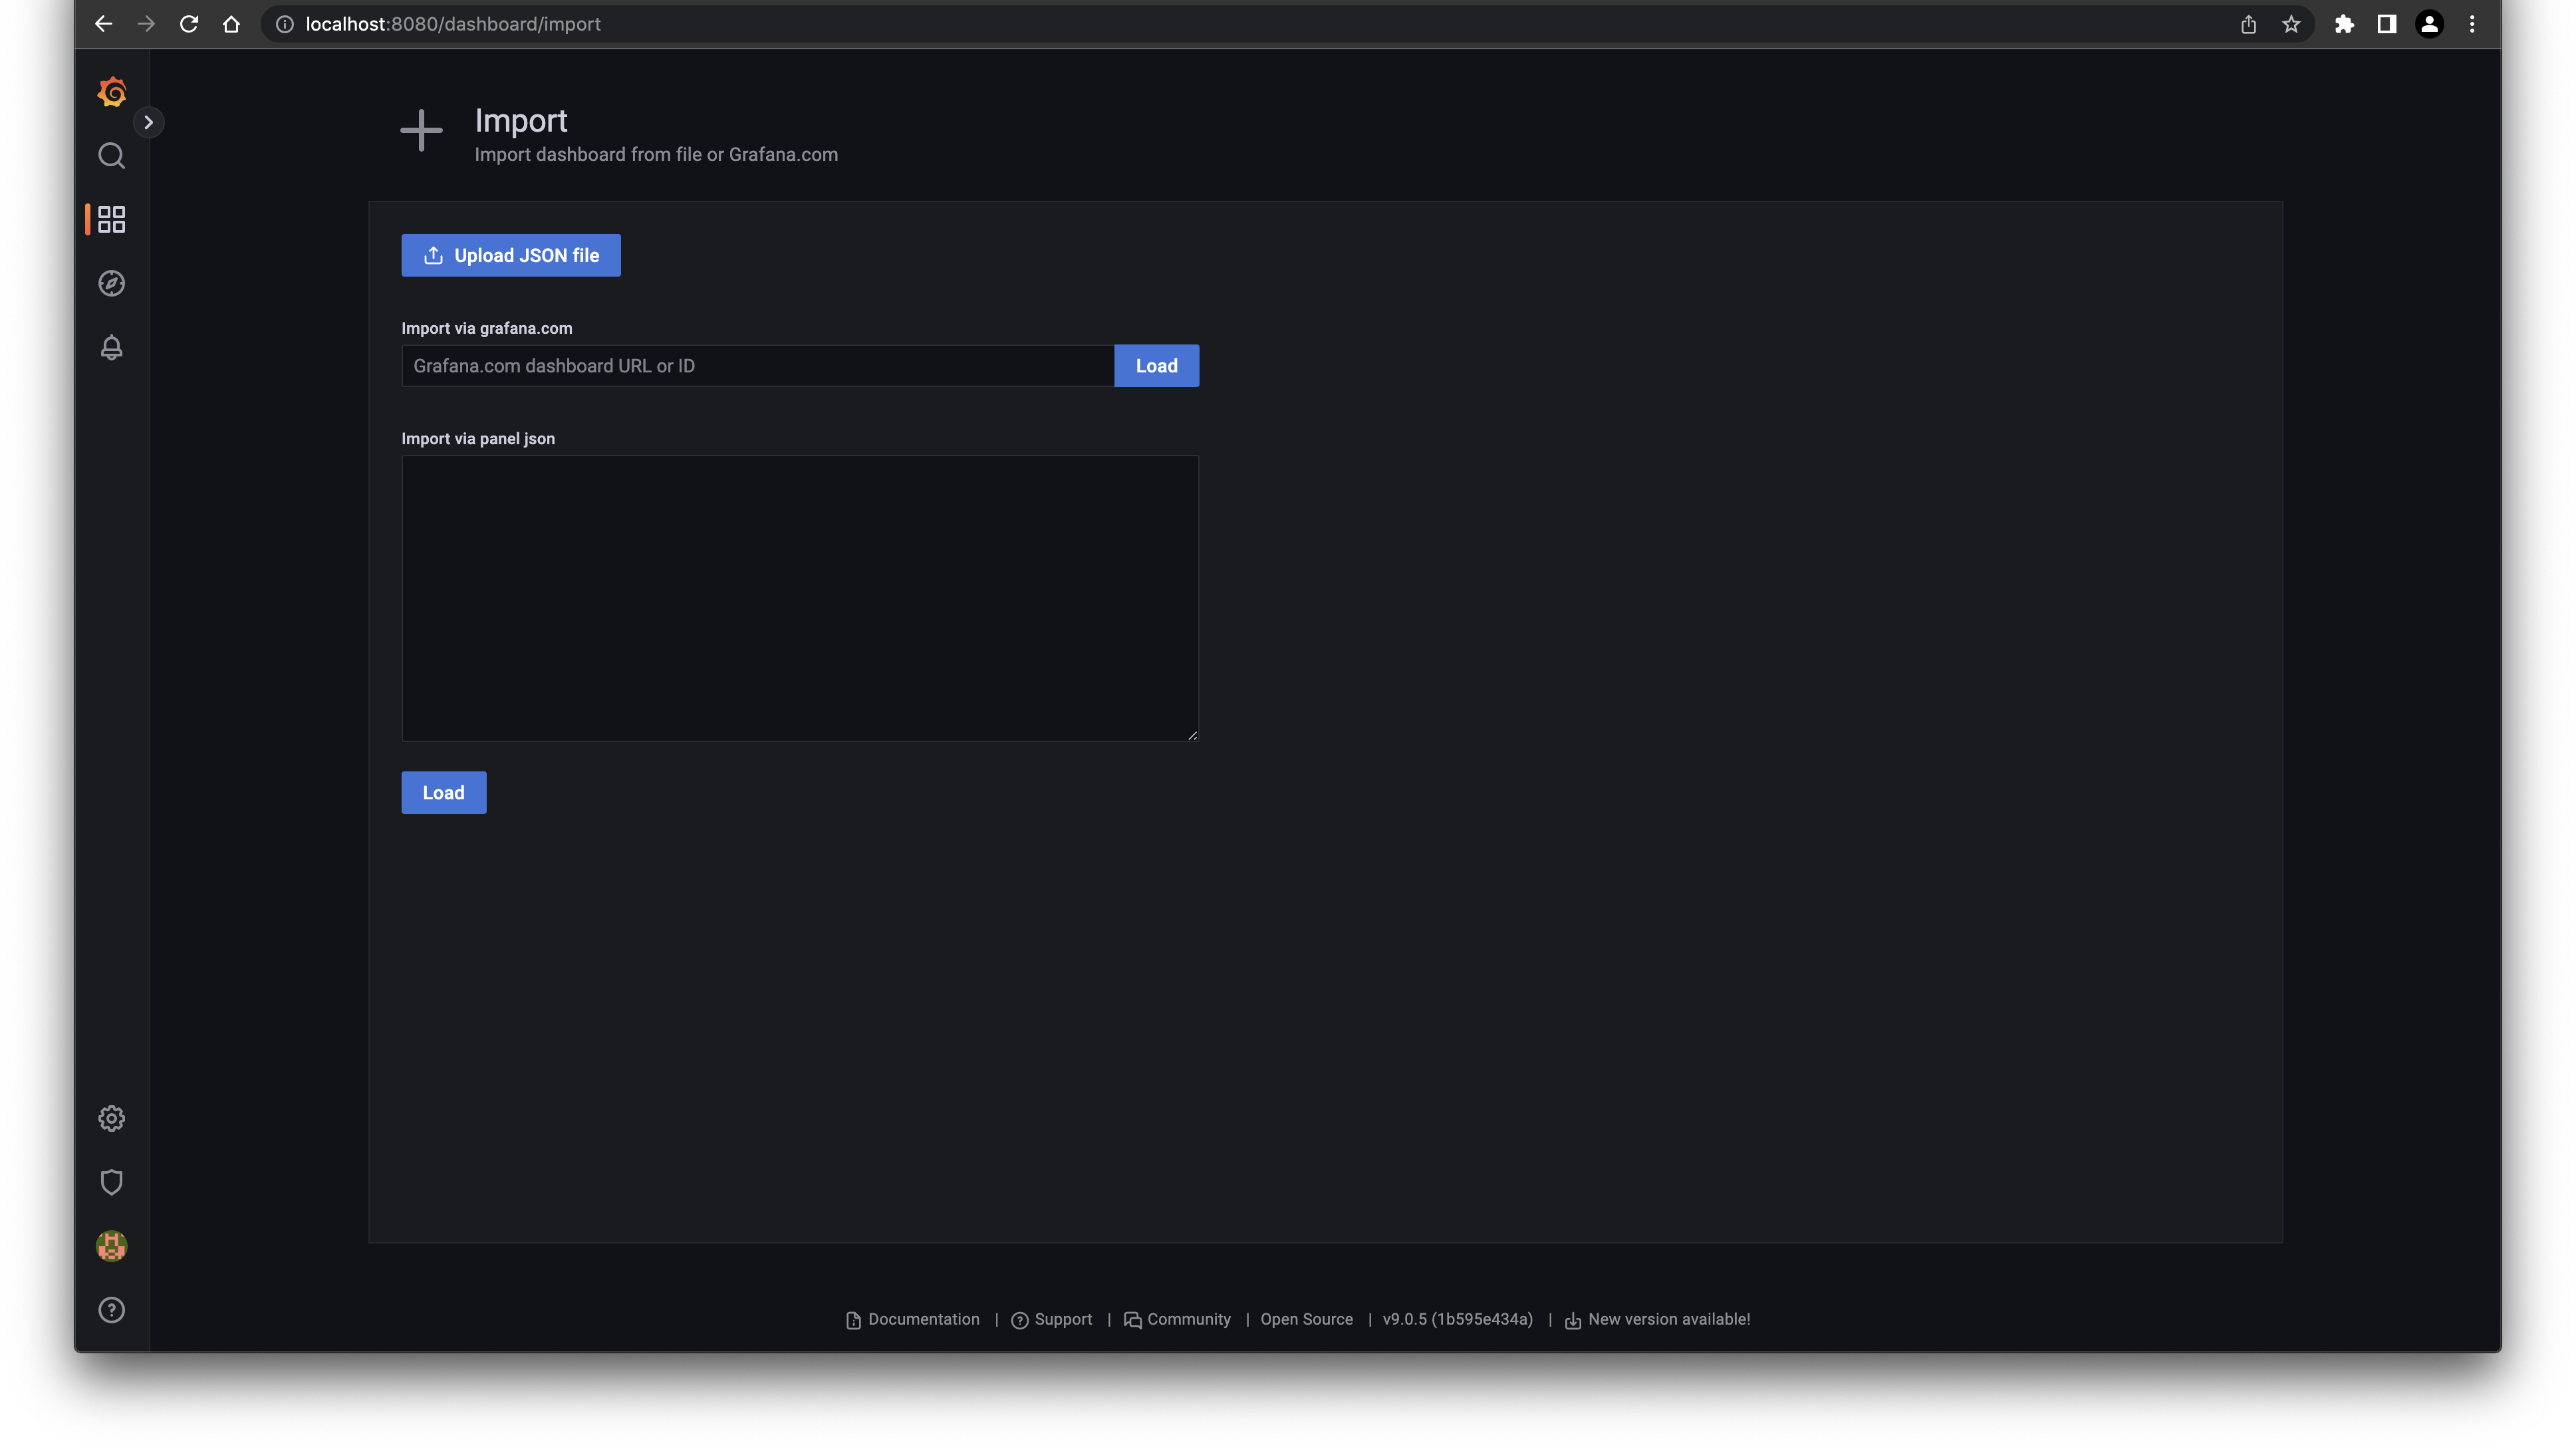
To access our demo Grafana instance, I use again port-forward with following command:
kubectl port-forward svc/kube-prometheus-stack-3eaccf33-grafana 8080:80 -n monitoring
Naviage to the Import Dashboard view and enter the ID or the JSON:
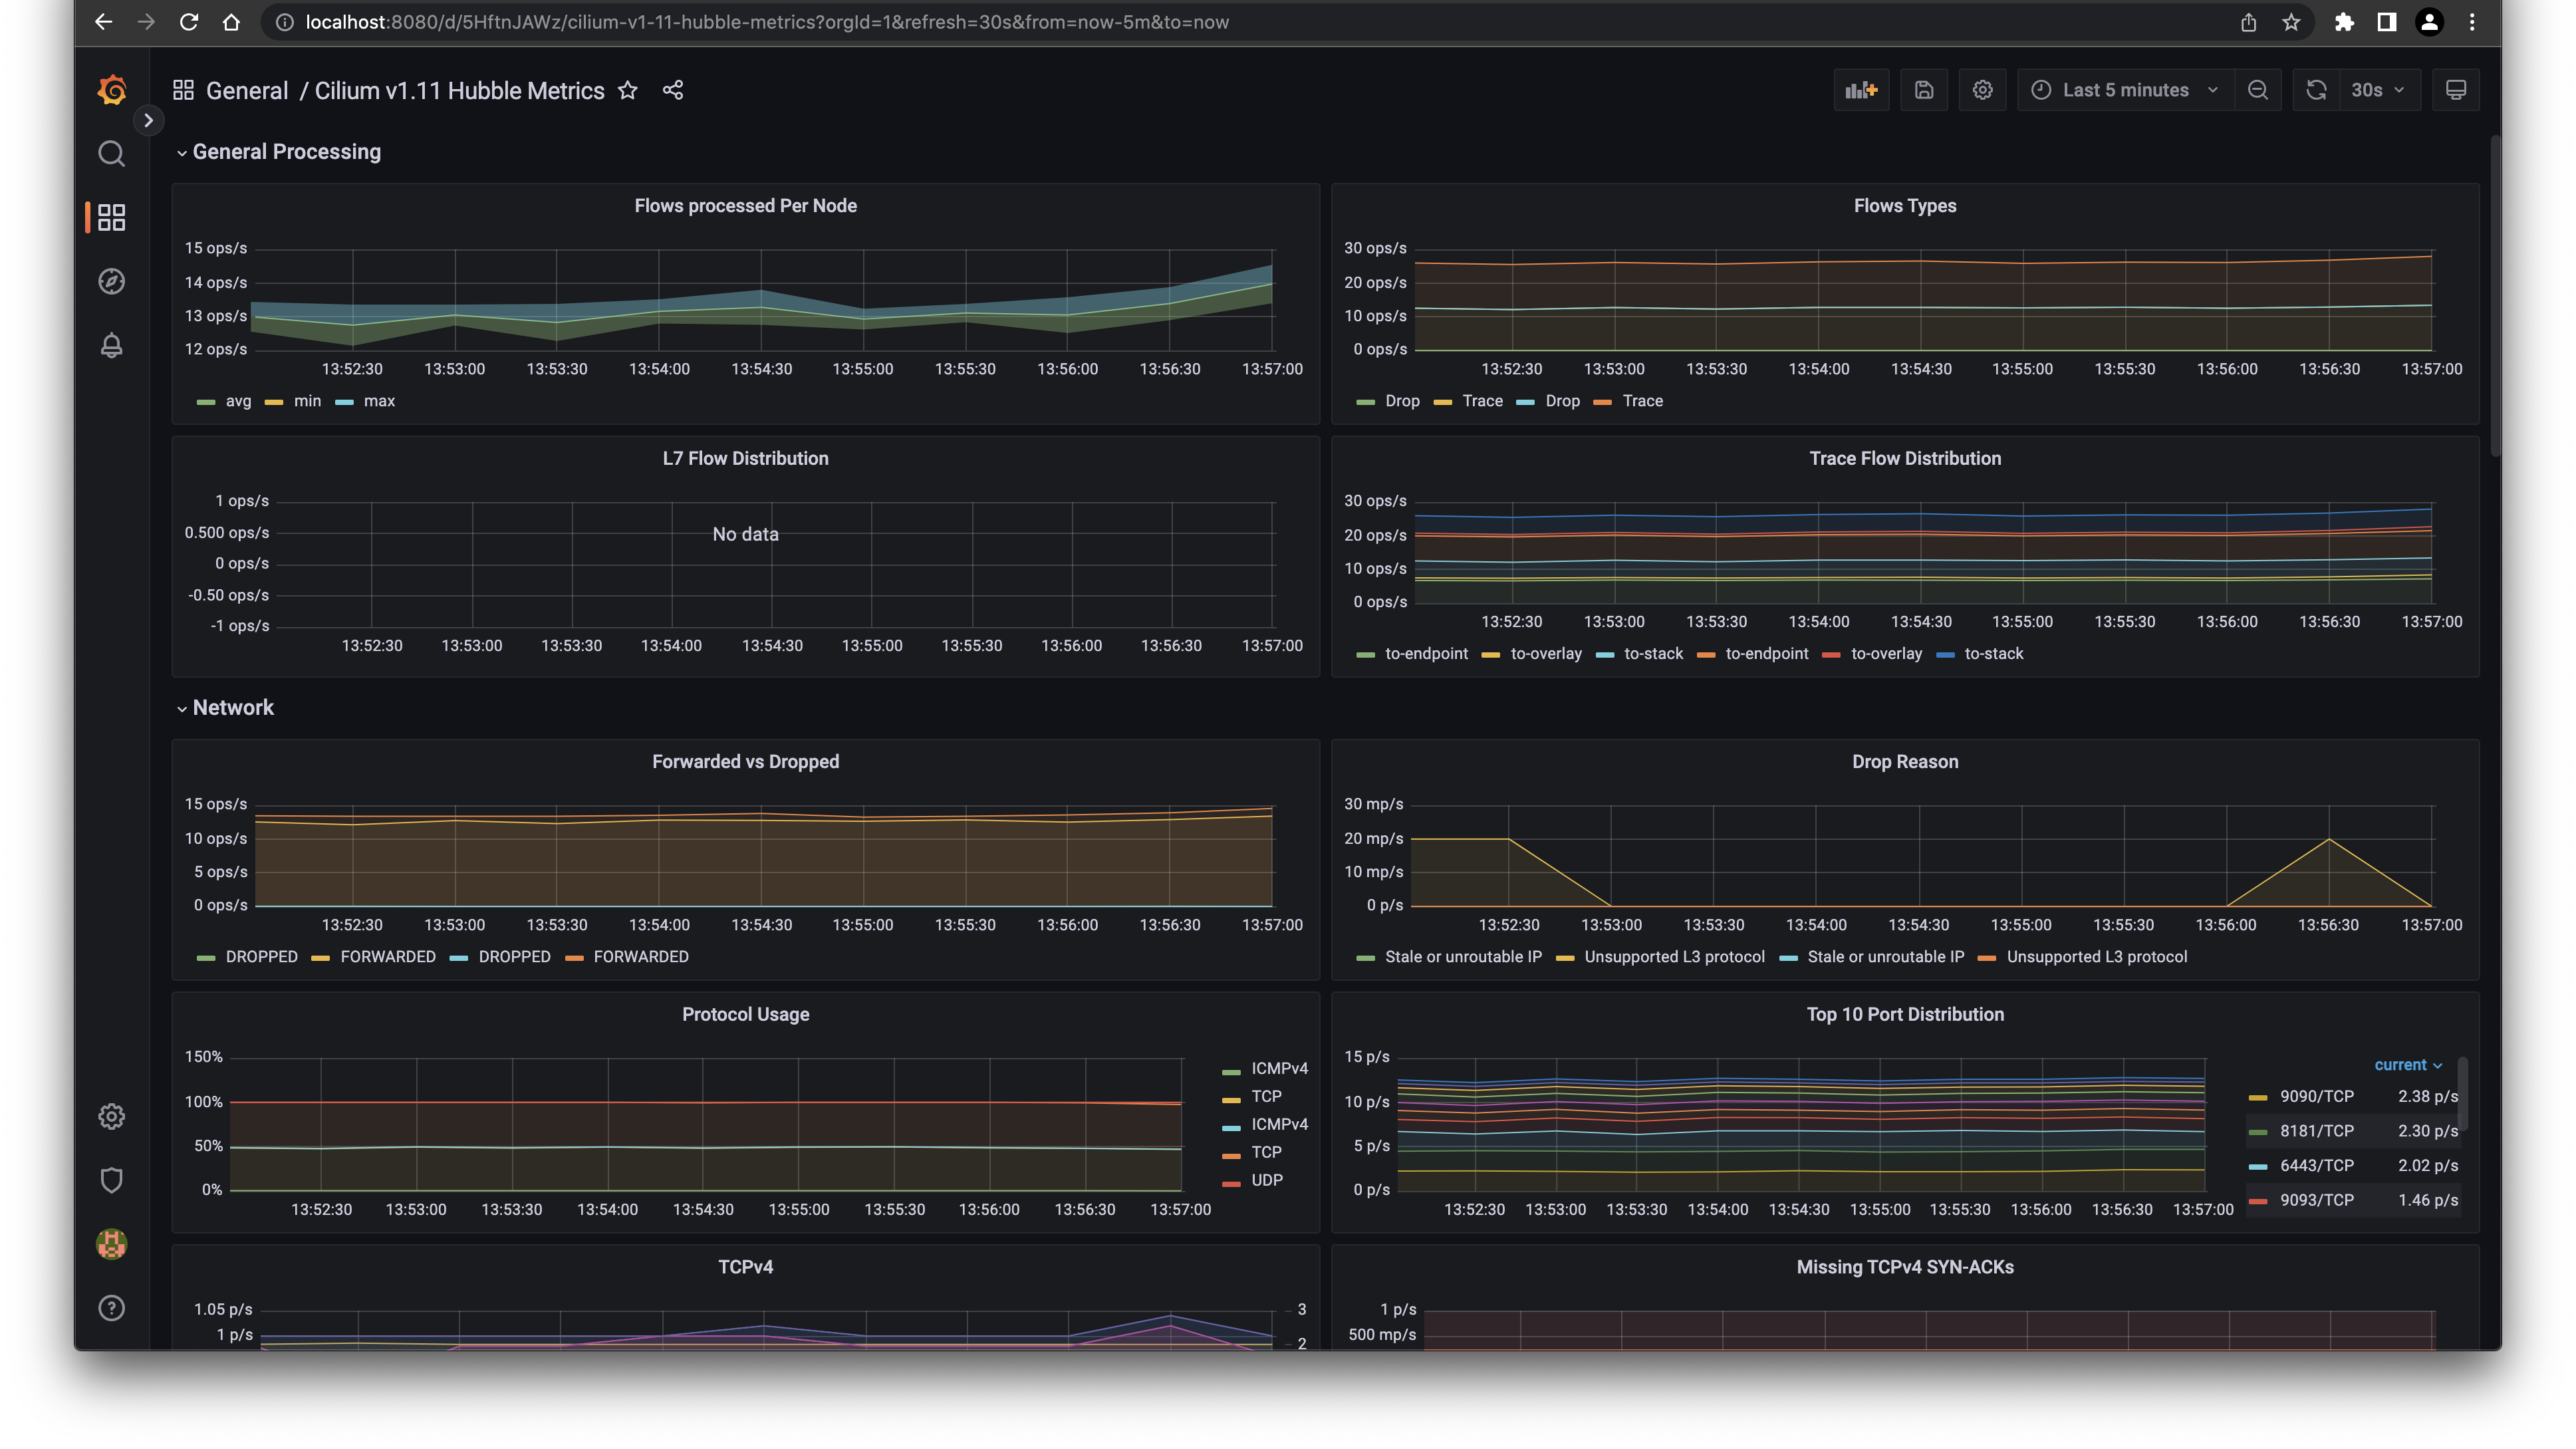
After the import the dashboard is ready to use:
Before we wrap up, let's have a look at the Hubble UI to see the flow of traffic in our monitoring namespace.
cilium hubble ui
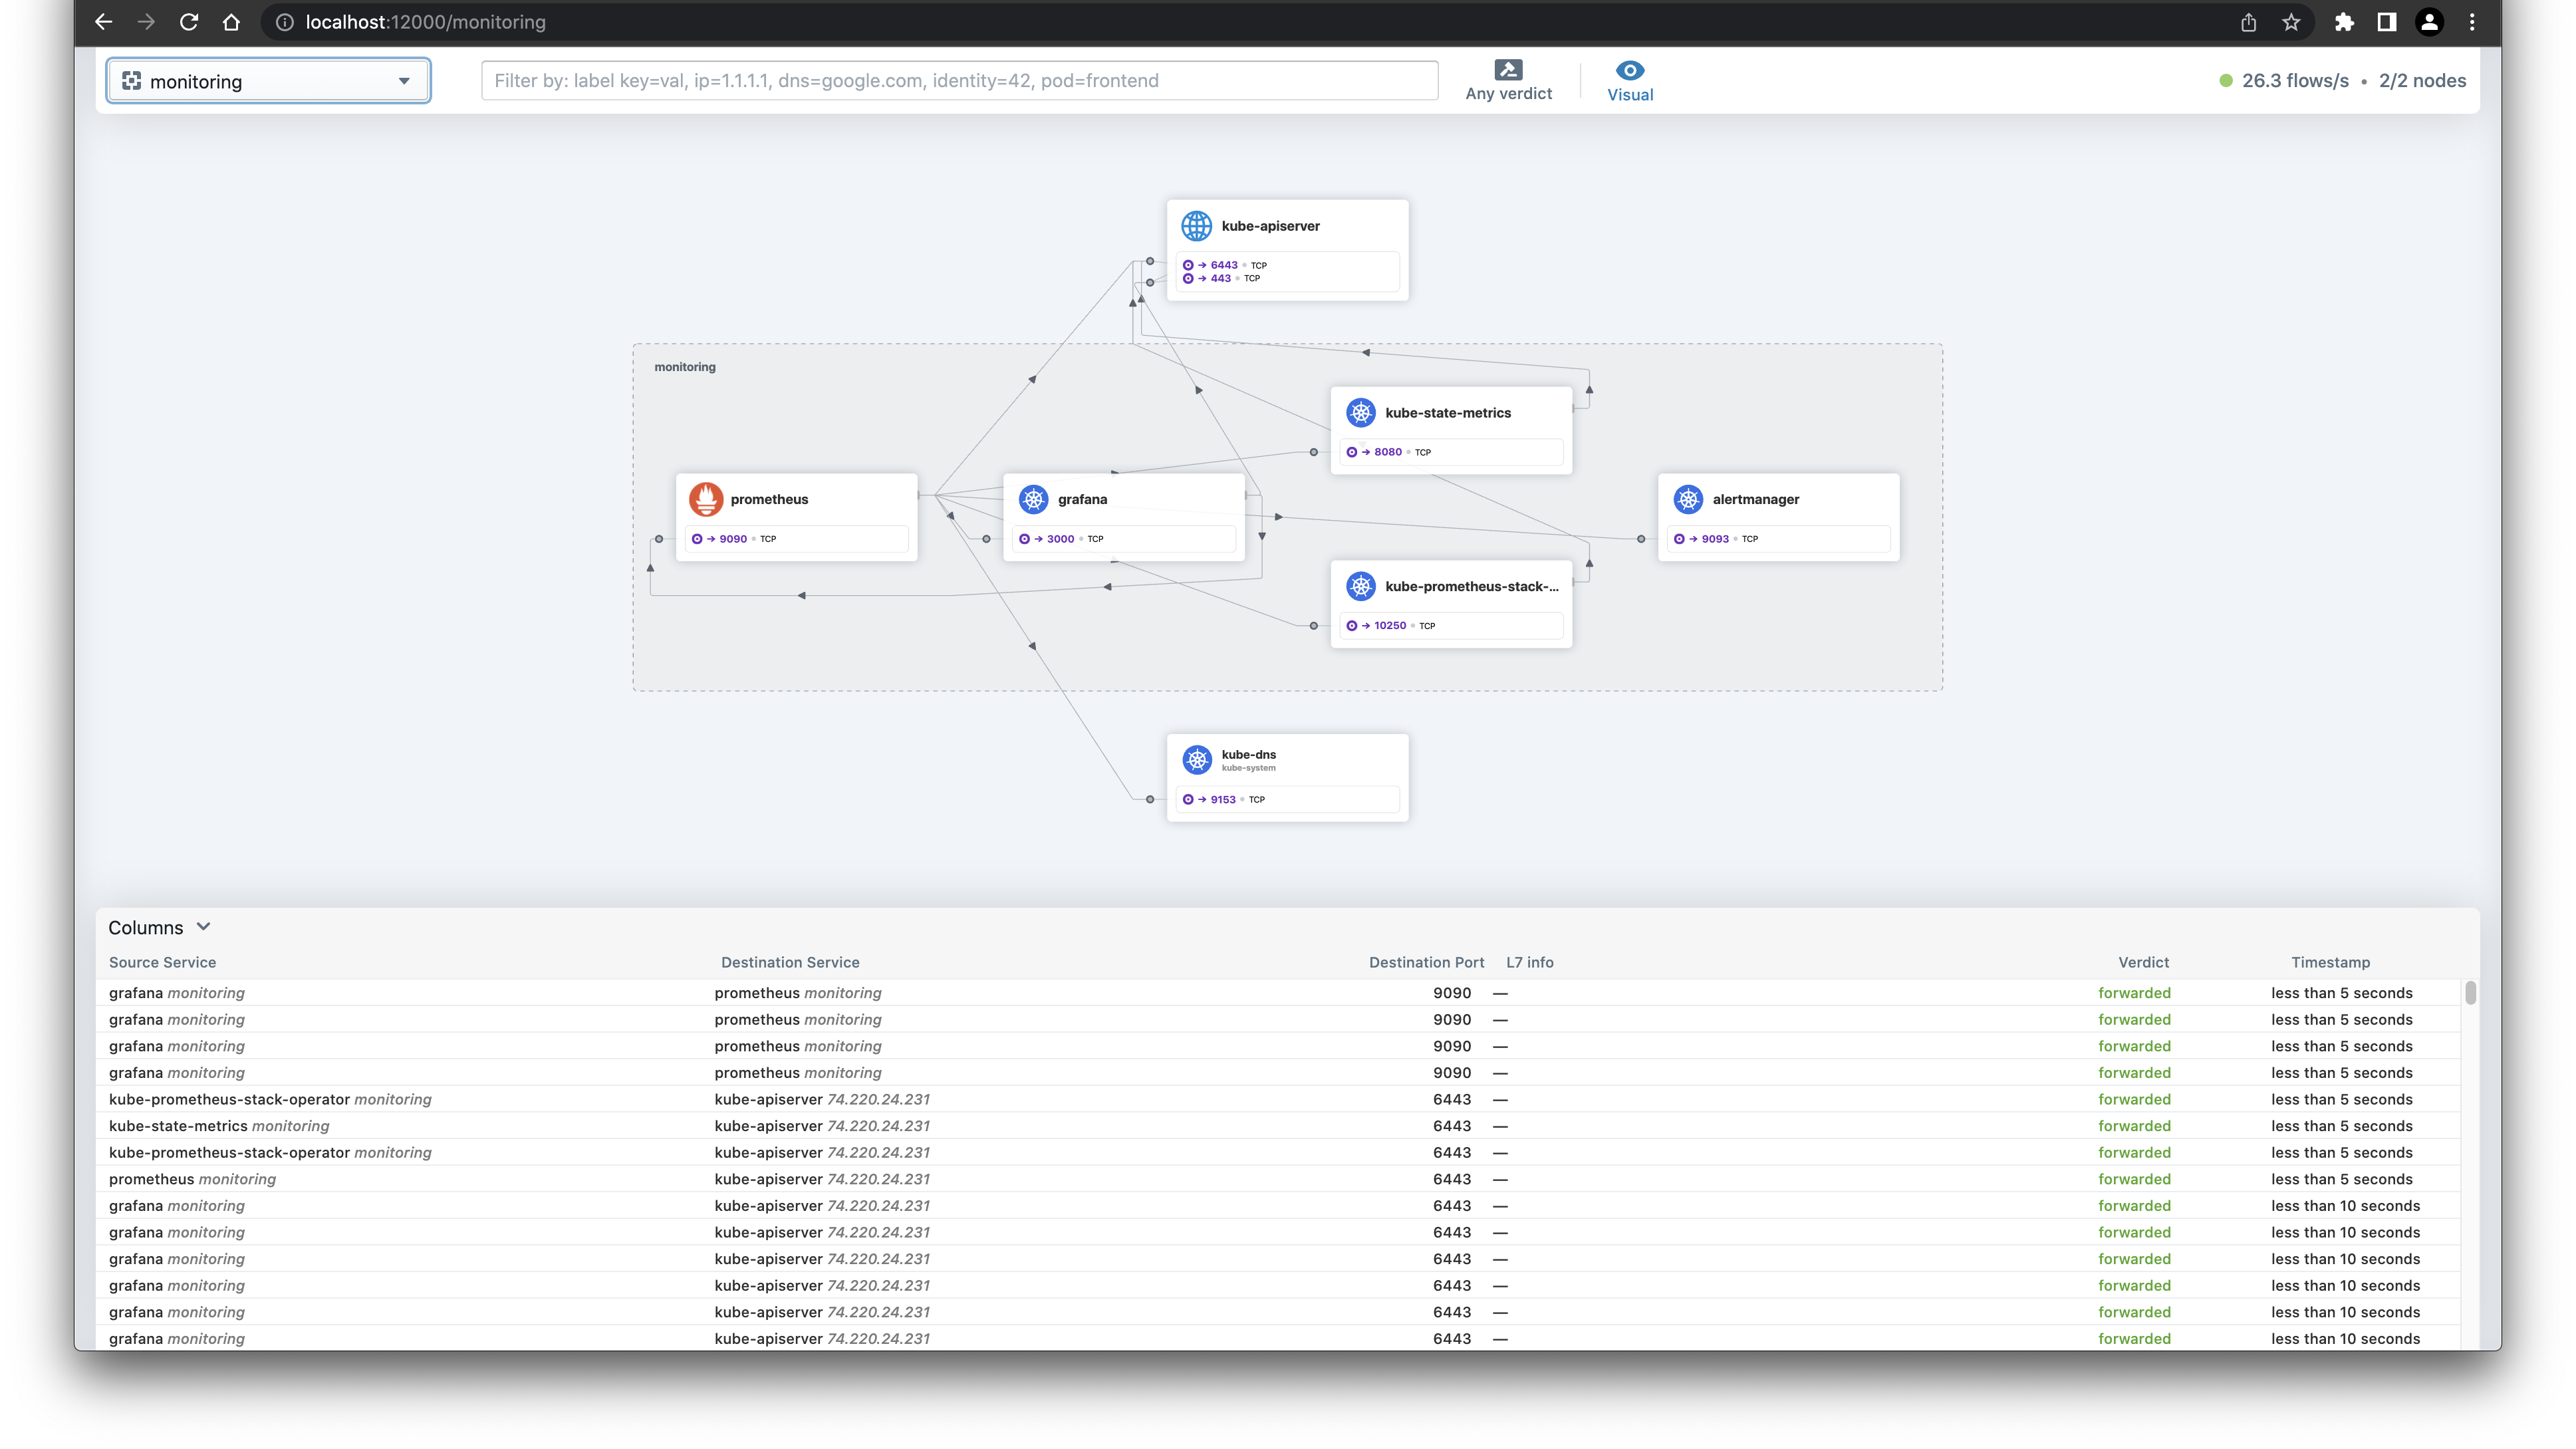
Interesting are the flows of Grafana. Next to the connection to the API server, there is also a connection to the so called world.
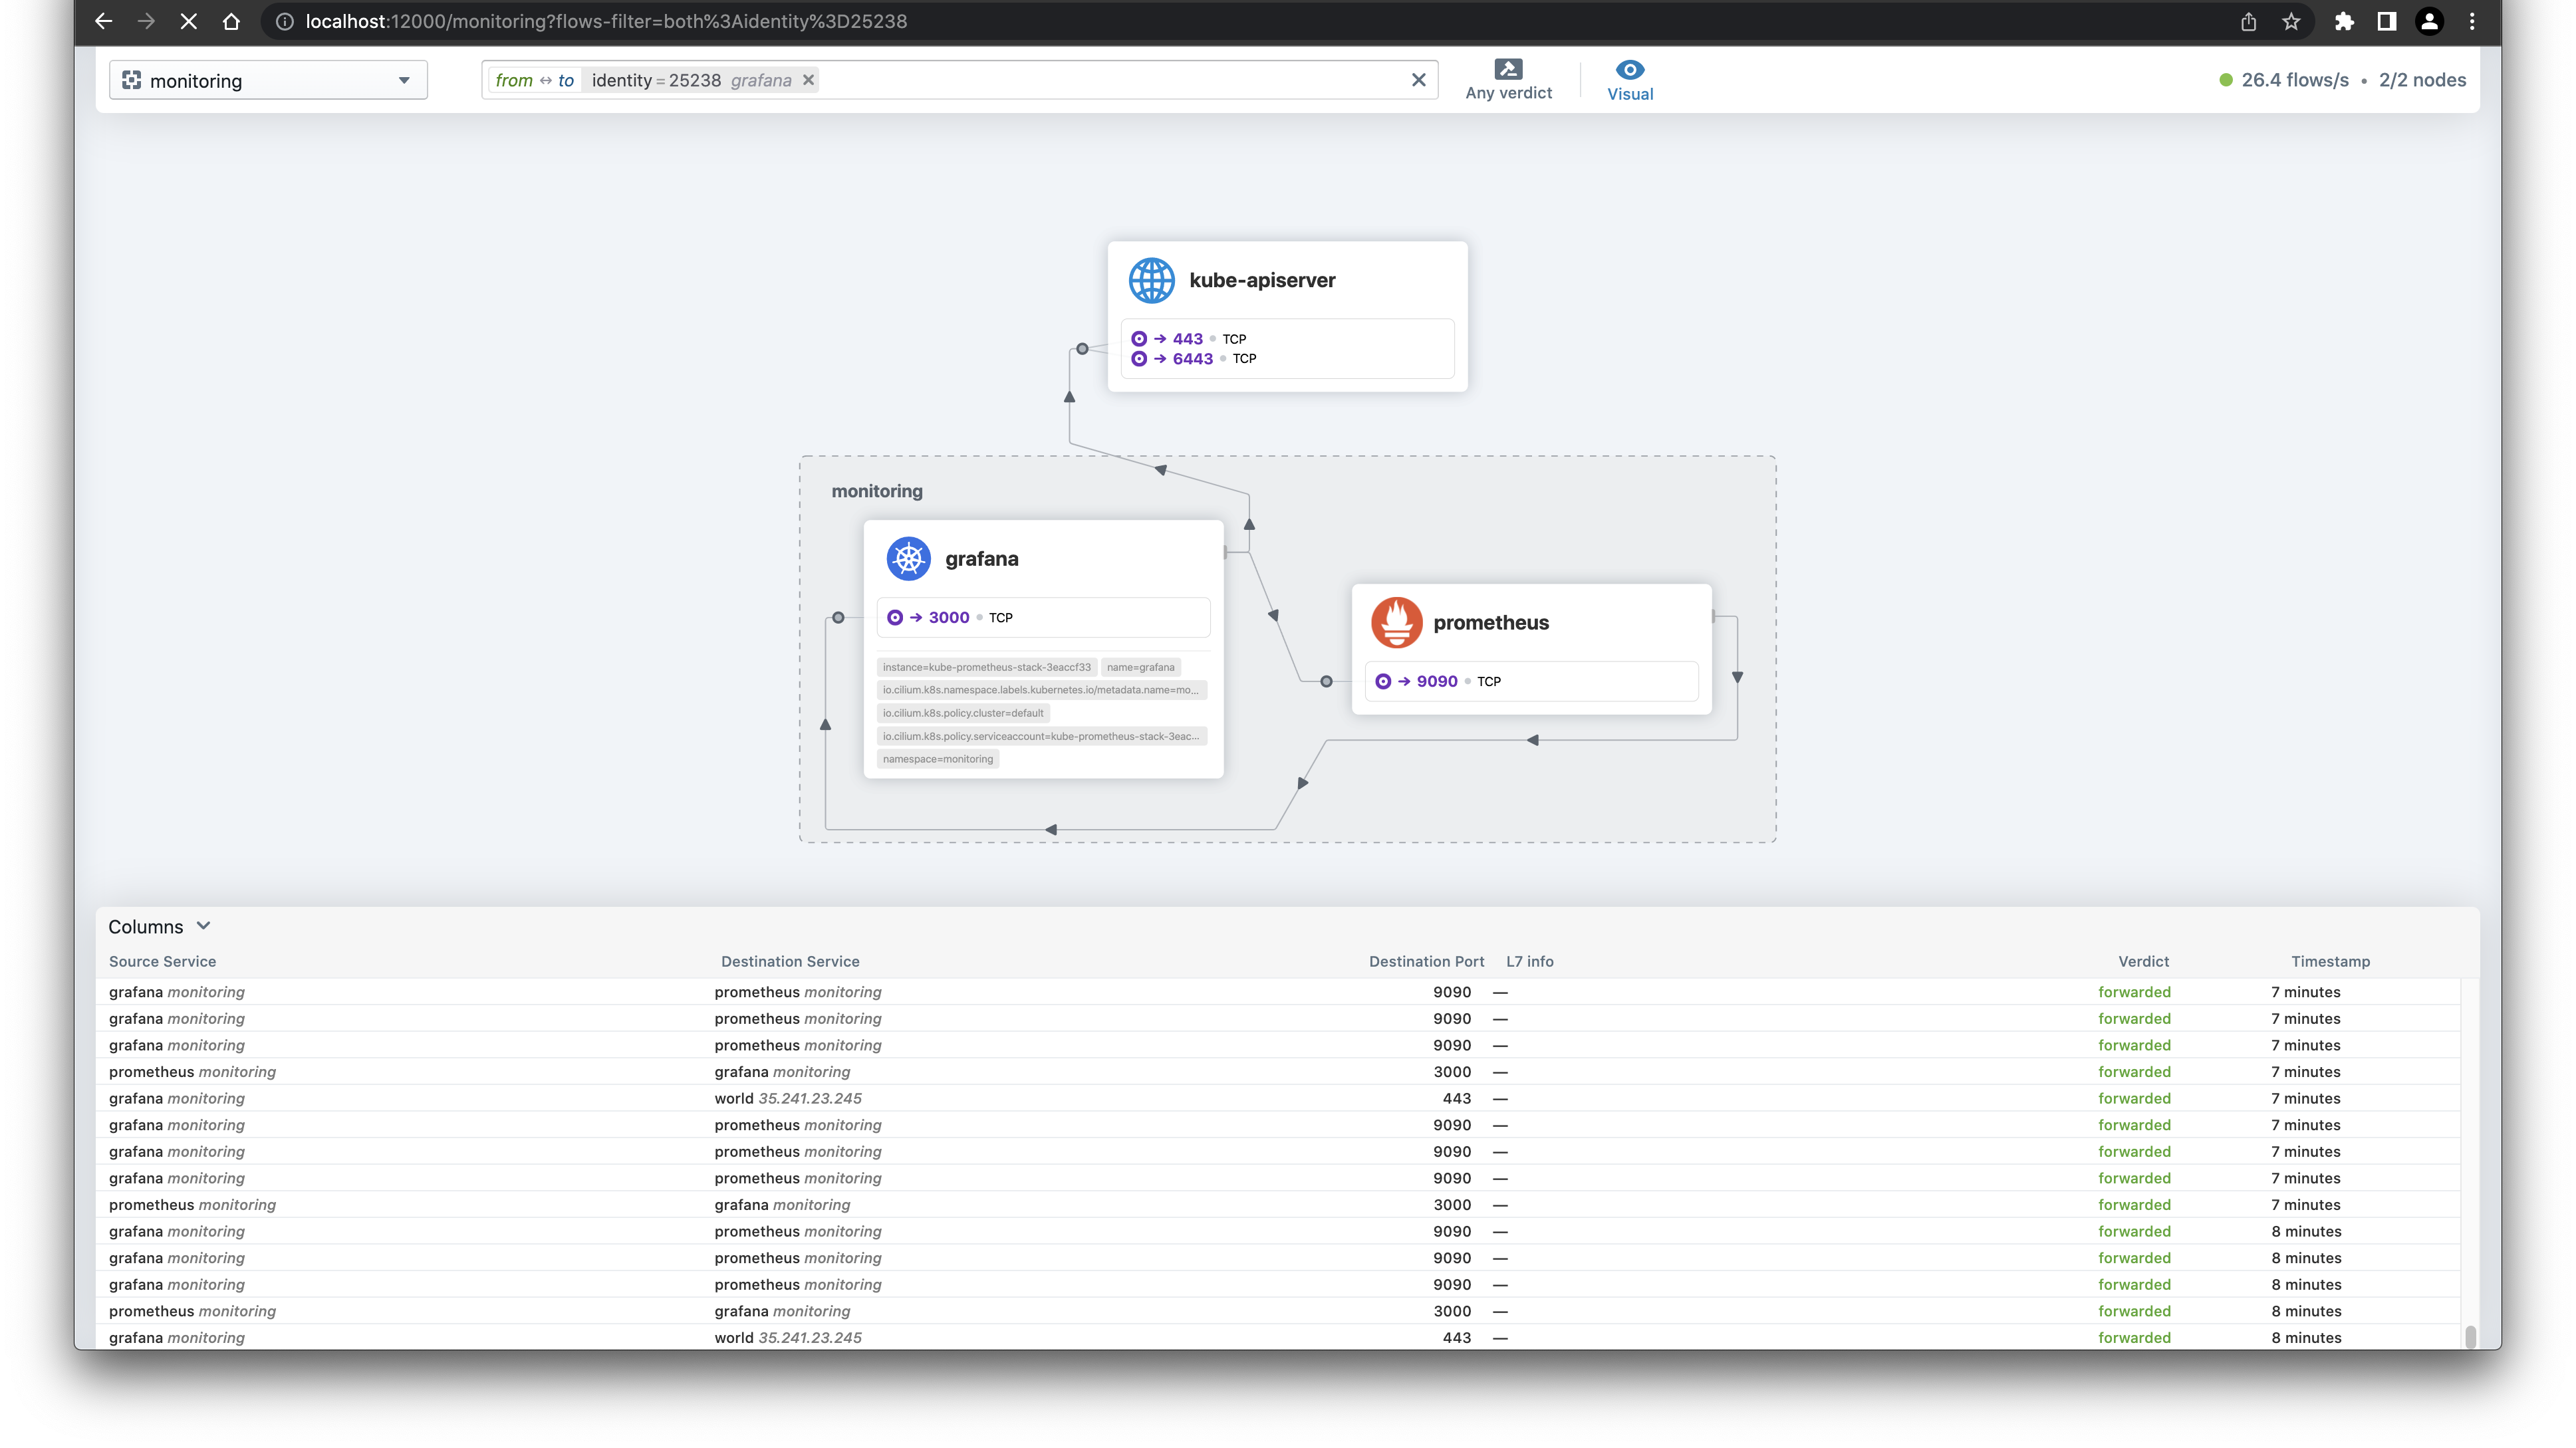
Make sense, as we just downloaded the Dashboard from the Grafana website. The Hubble UI is really a useful tool to see what traffic is going on in your cluster and a good starting point to build NetworkPolicies.
Wrap-up
Now we extended the Civo Cilium deployment with some Prometheus metrics endpoints and enabled ServiceMonitors so our monitoring stack will pick up the metrics.
With importing the predefined dashboards, we have also a very visual appealing way of presenting the metrics to the persons interested in those metrics.
See the official docs about Cilium and Hubble for further details.