How To Set Up a Dead Man’s Switch in Prometheus
A reference implementation with healthchecks.io
Cloud Native Pilgrim | Kubernetes Enthusiast | Serverless Believer | Customer Experience Architect @ Pulumi | (he/him) | CK{A,AD} |
Introduction
A rule of thumb: If you're going to build a system, you need to monitor it! Knowing the current health of your system is crucial to guarantee that it's working as designed.
A monitoring system can be very very simple, like a ping to a server IP. Or monitoring in complicated distributed systems that every component is working as expected. No matter how sophisticated the monitoring system is, we rely on them to ensure that our main system is in a healthy state.
But what happens when your monitoring system fails? How do you know that your monitoring system is healthy?
A frequent question, I got asked when working with our DevOps teams was:
Who is monitoring the monitoring system to make sure it's working?
And there is a concept, we can borrow from the physical engineering world: It's the concept of the dead man's switch.
The idea is that there is a system that requires human interaction to keep it running. If human interaction stops, the system will stop functioning. I encountered this system when visiting a train cockpit in a museum. Every train cockpit has a button that requires the train conductor to push at a certain interval. If the driver doesn't push the button, the train will stop safely, as the system assumes that the conductor is not able to operate the train anymore. This could be for example due to medical reasons. There are plenty of other examples where physical interaction is required to keep a system running, like a lawn mower or chainsaw.
So how can we apply this concept to our monitoring system? To transform the concept of a dead man's switch into the Prometheus world we need to:
Create a
Prometheusalert that will fire regularly, like the train conductor pushing the button.Configuring the
Alertmanagerto send to another system outside our primary monitoring system.This outside system will take care of the alert and notify us if it doesn't receive the alert.
In the following sections, we will go through each of these steps in detail.
Setting up the dead man's switch
I will use the following services and tools:
kube-prometeus-stackHelm chart to deployPrometheusandAlertmanagerhealthchecks.io to send the alerts to. (Alternatively you could use also https://deadmanssnitch.com/)
A
Kubernetescluster to deploy the onto. I will useDocker Desktopfor Mac to deploy the services, you can use anyKubernetescluster you want.
Sign up for healthchecks.io
Healthchecks is a cron job monitoring service. It listens for HTTP requests and email messages ("pings") from your cron jobs and scheduled tasks ("checks"). When a ping does not arrive on time, Healthchecks sends out alerts.
Healthchecks comes with a web dashboard, API, 25+ integrations for delivering notifications, monthly email reports, WebAuthn 2FA support, team management features: projects, team members, read-only access.
It's open source if you want to host it yourself. Check out the GitHub repository for more information.
I am going to use the free tier (Hobbyist) of their hosted service. You can sign up for a free account on https://healthchecks.io/
After signing up, you will be redirected to the dashboard. Here we get our first Check configured.

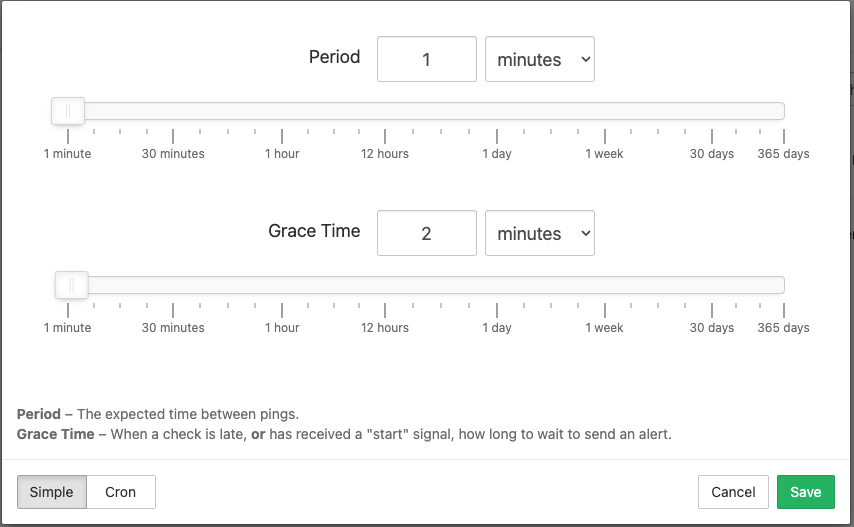
I will reduce the default period to 1 minute, so we can see the alert firing faster. I will also change the grace period to 2 minutes. The grace period is the time how long the check has to wait before it will send out an alert.
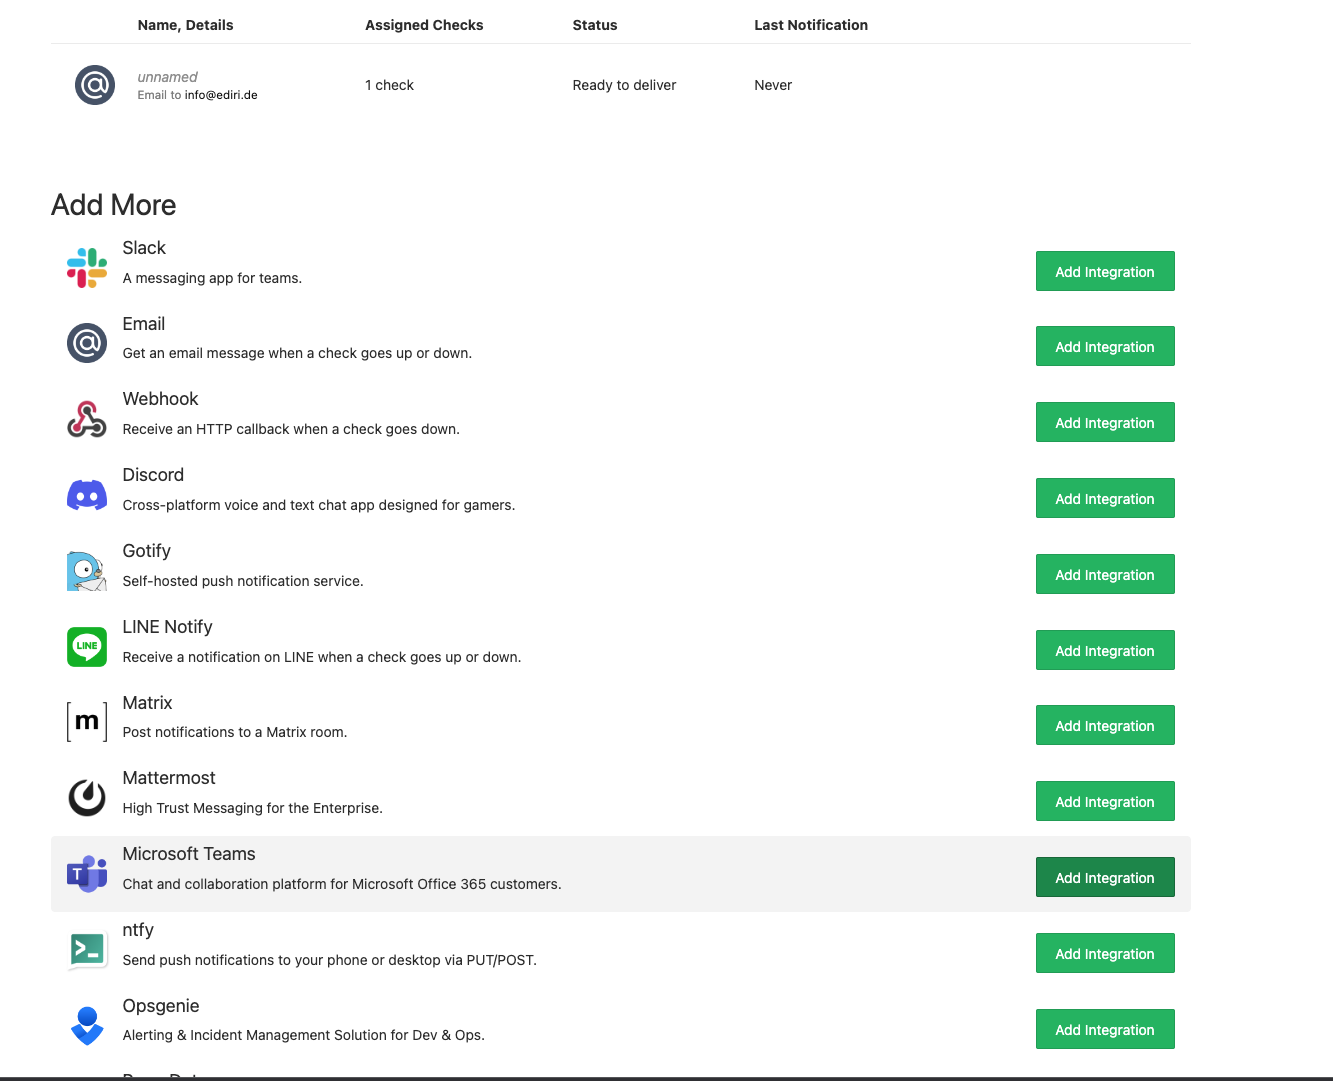
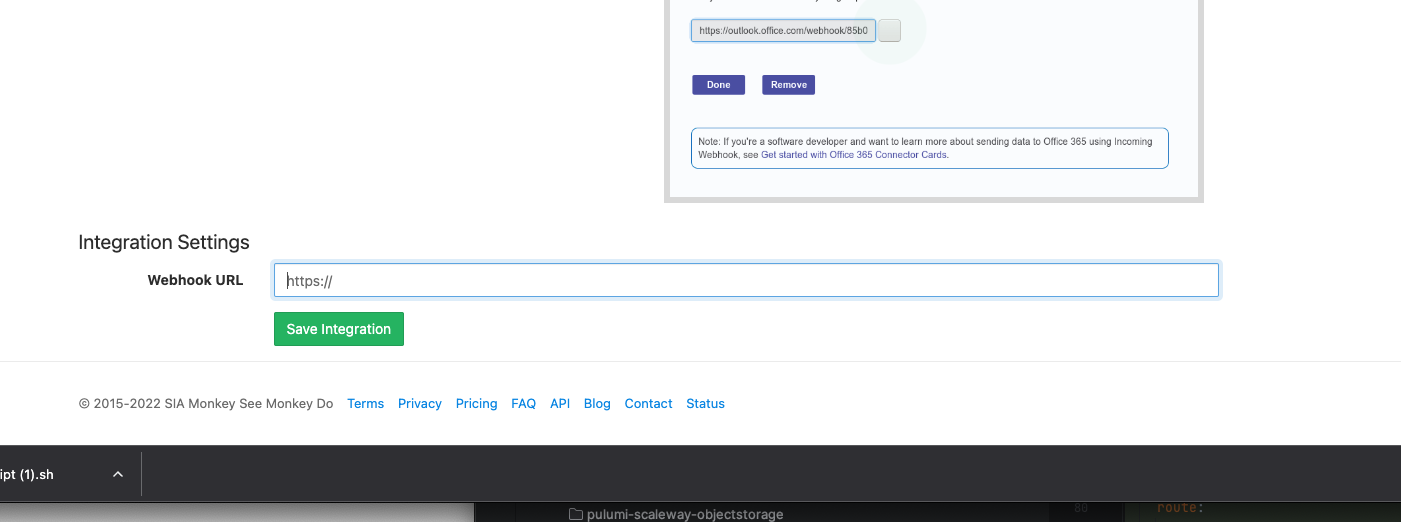
As an integration method I will choose Microsoft Teams and add the webhook URL of my Microsoft Teams channel.
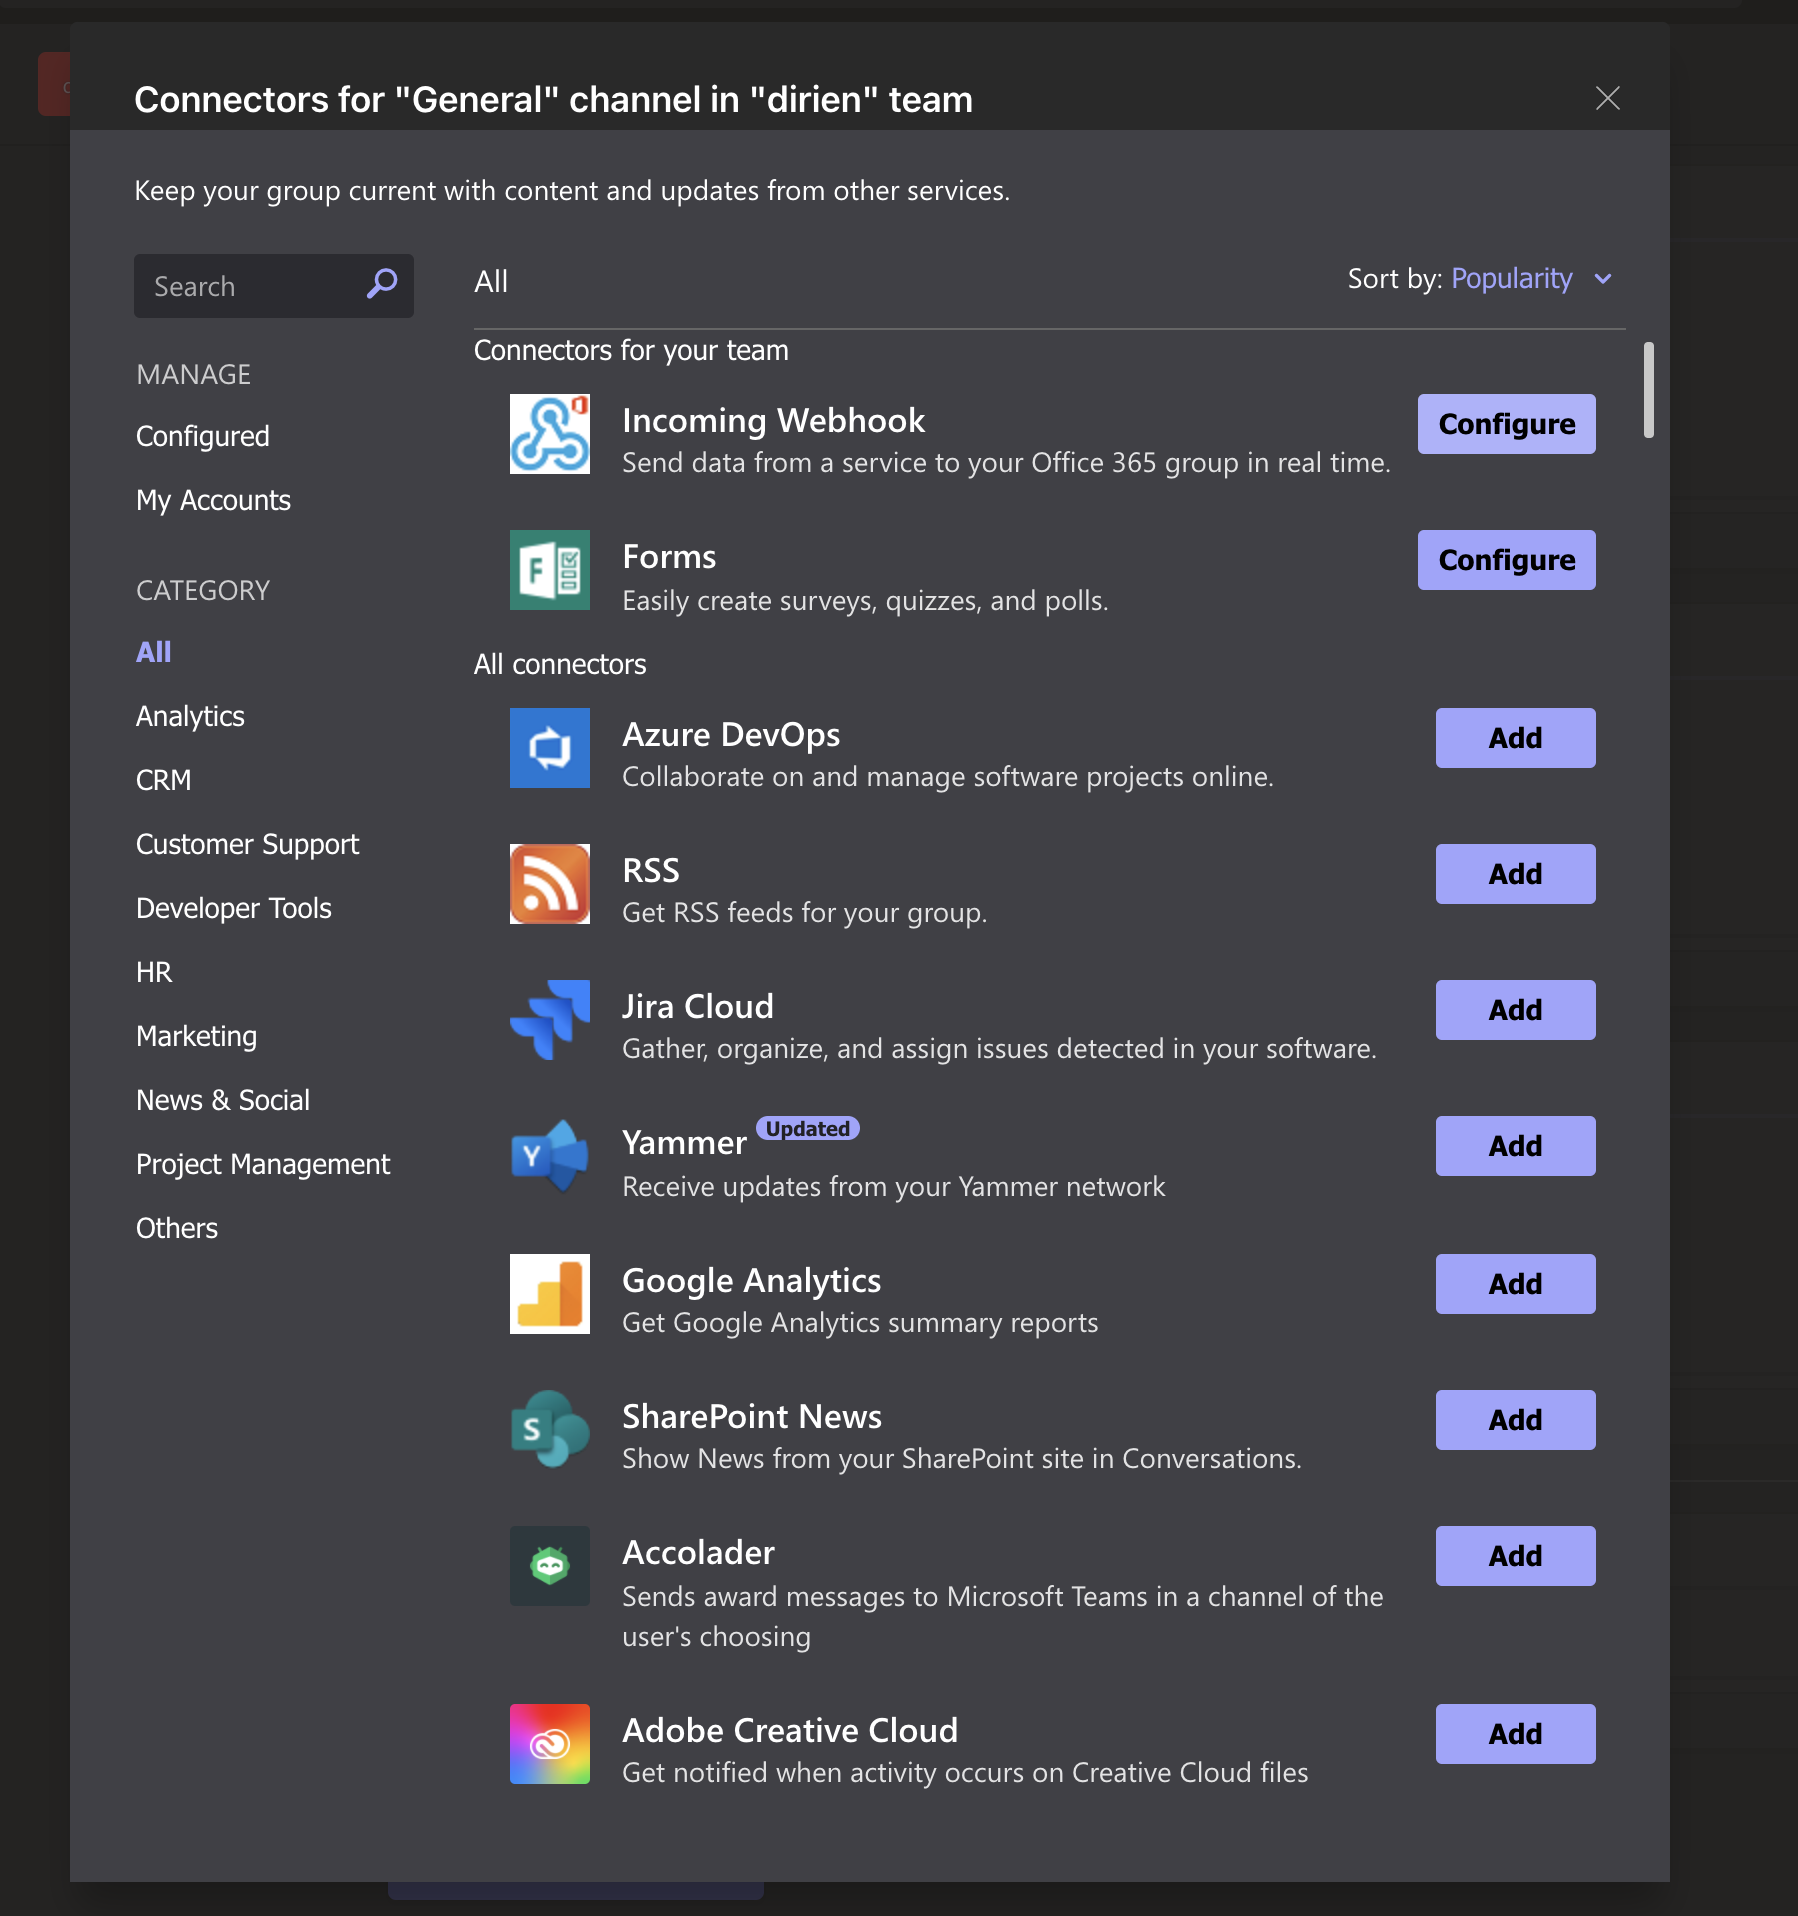
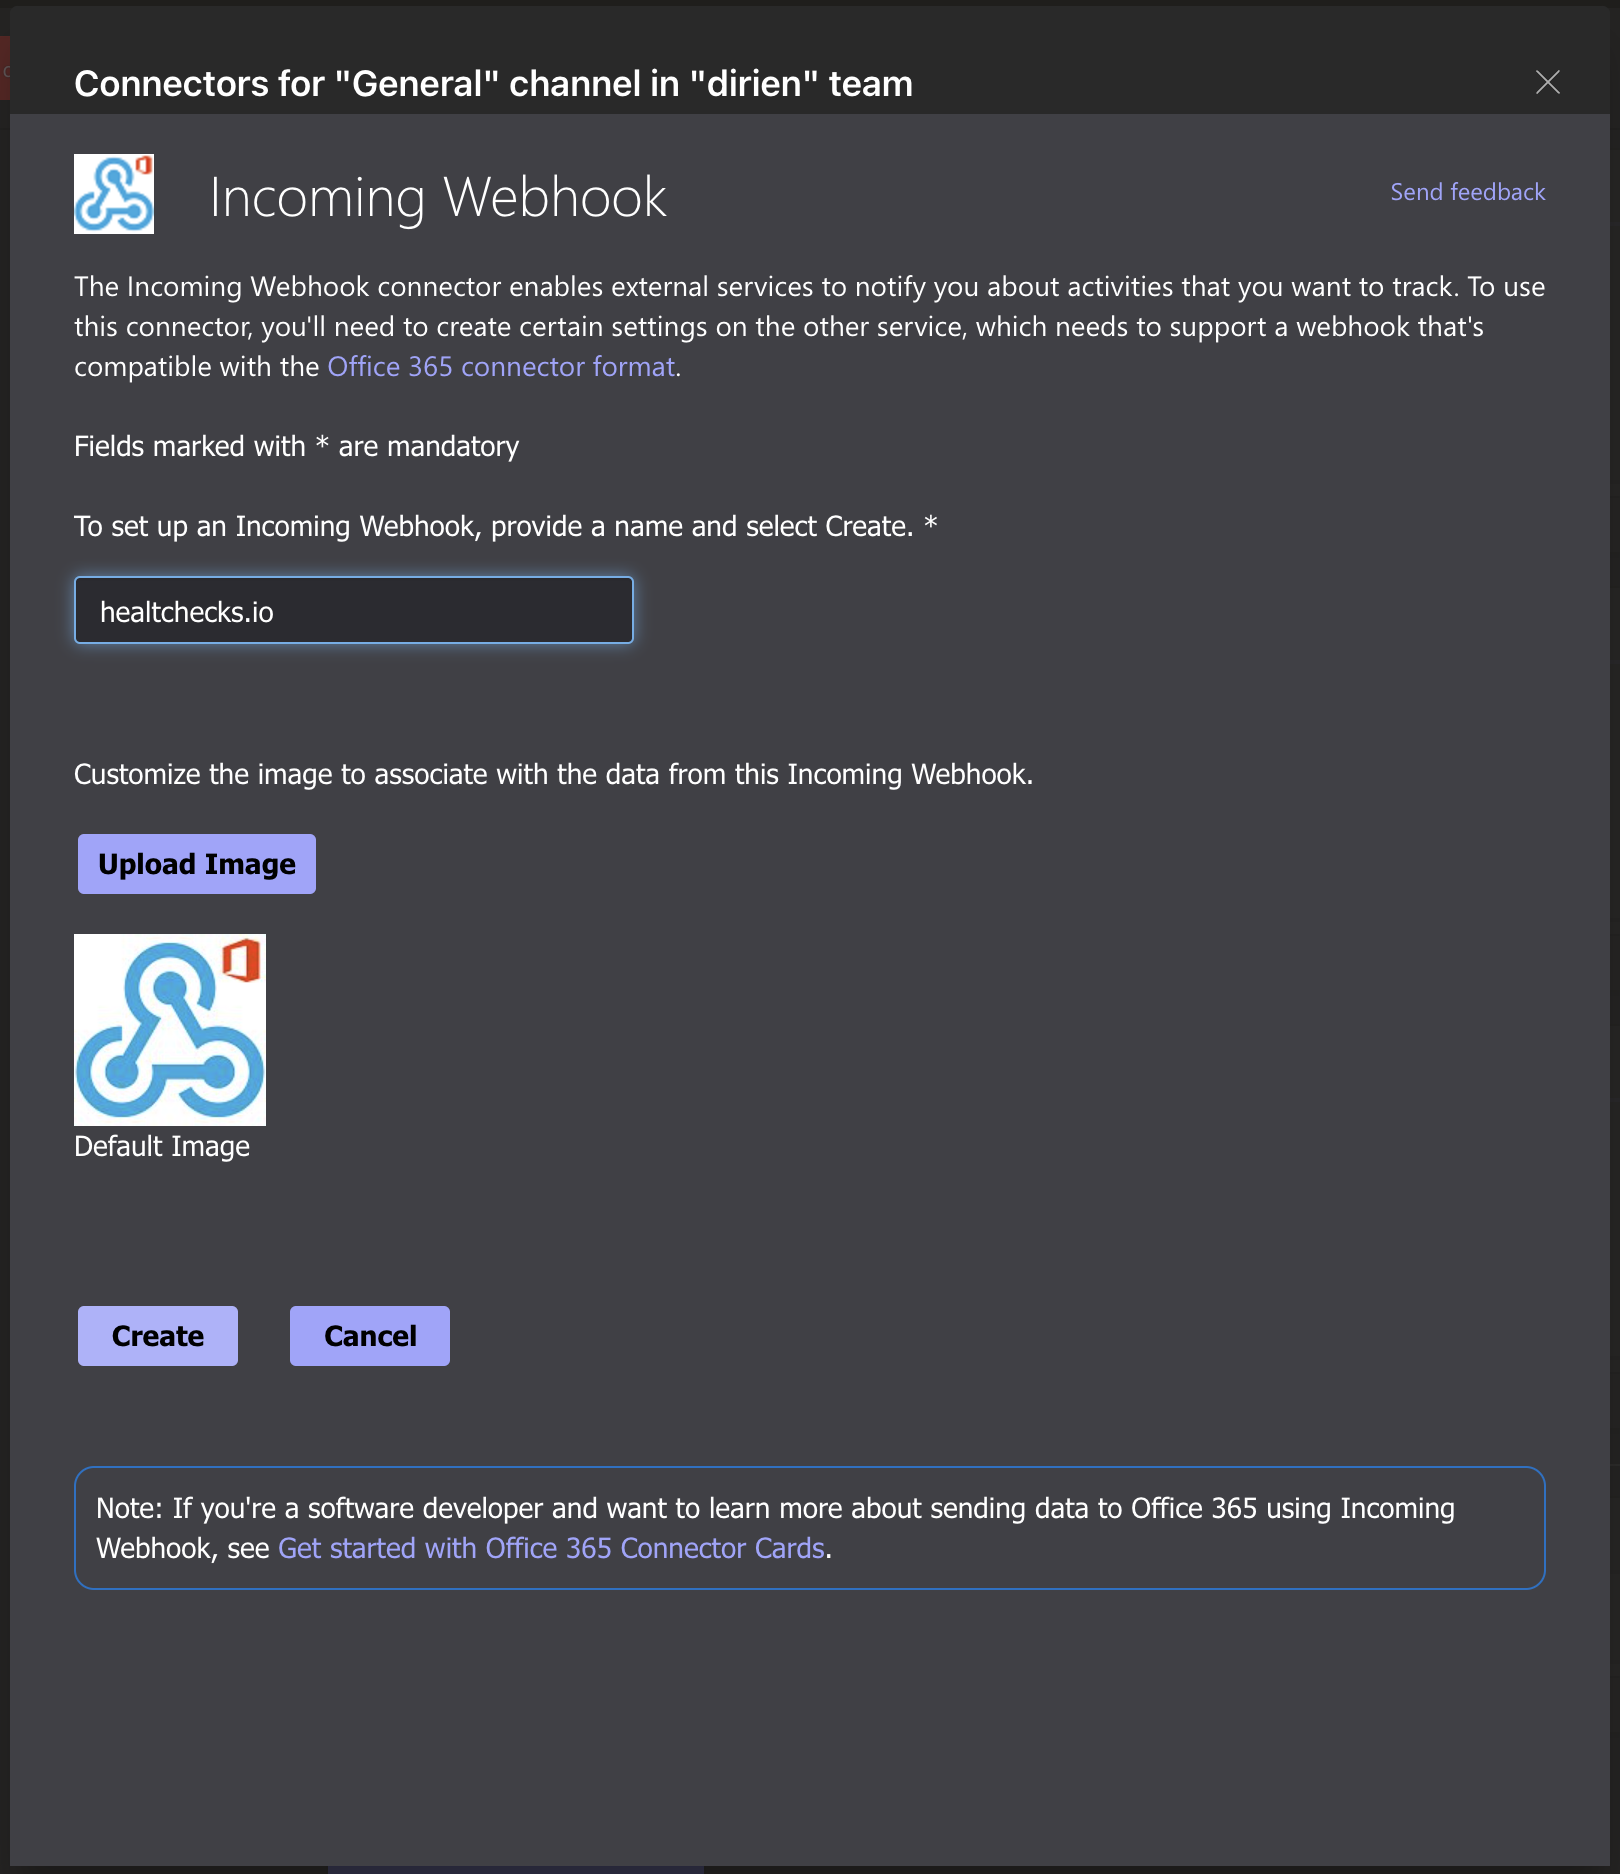
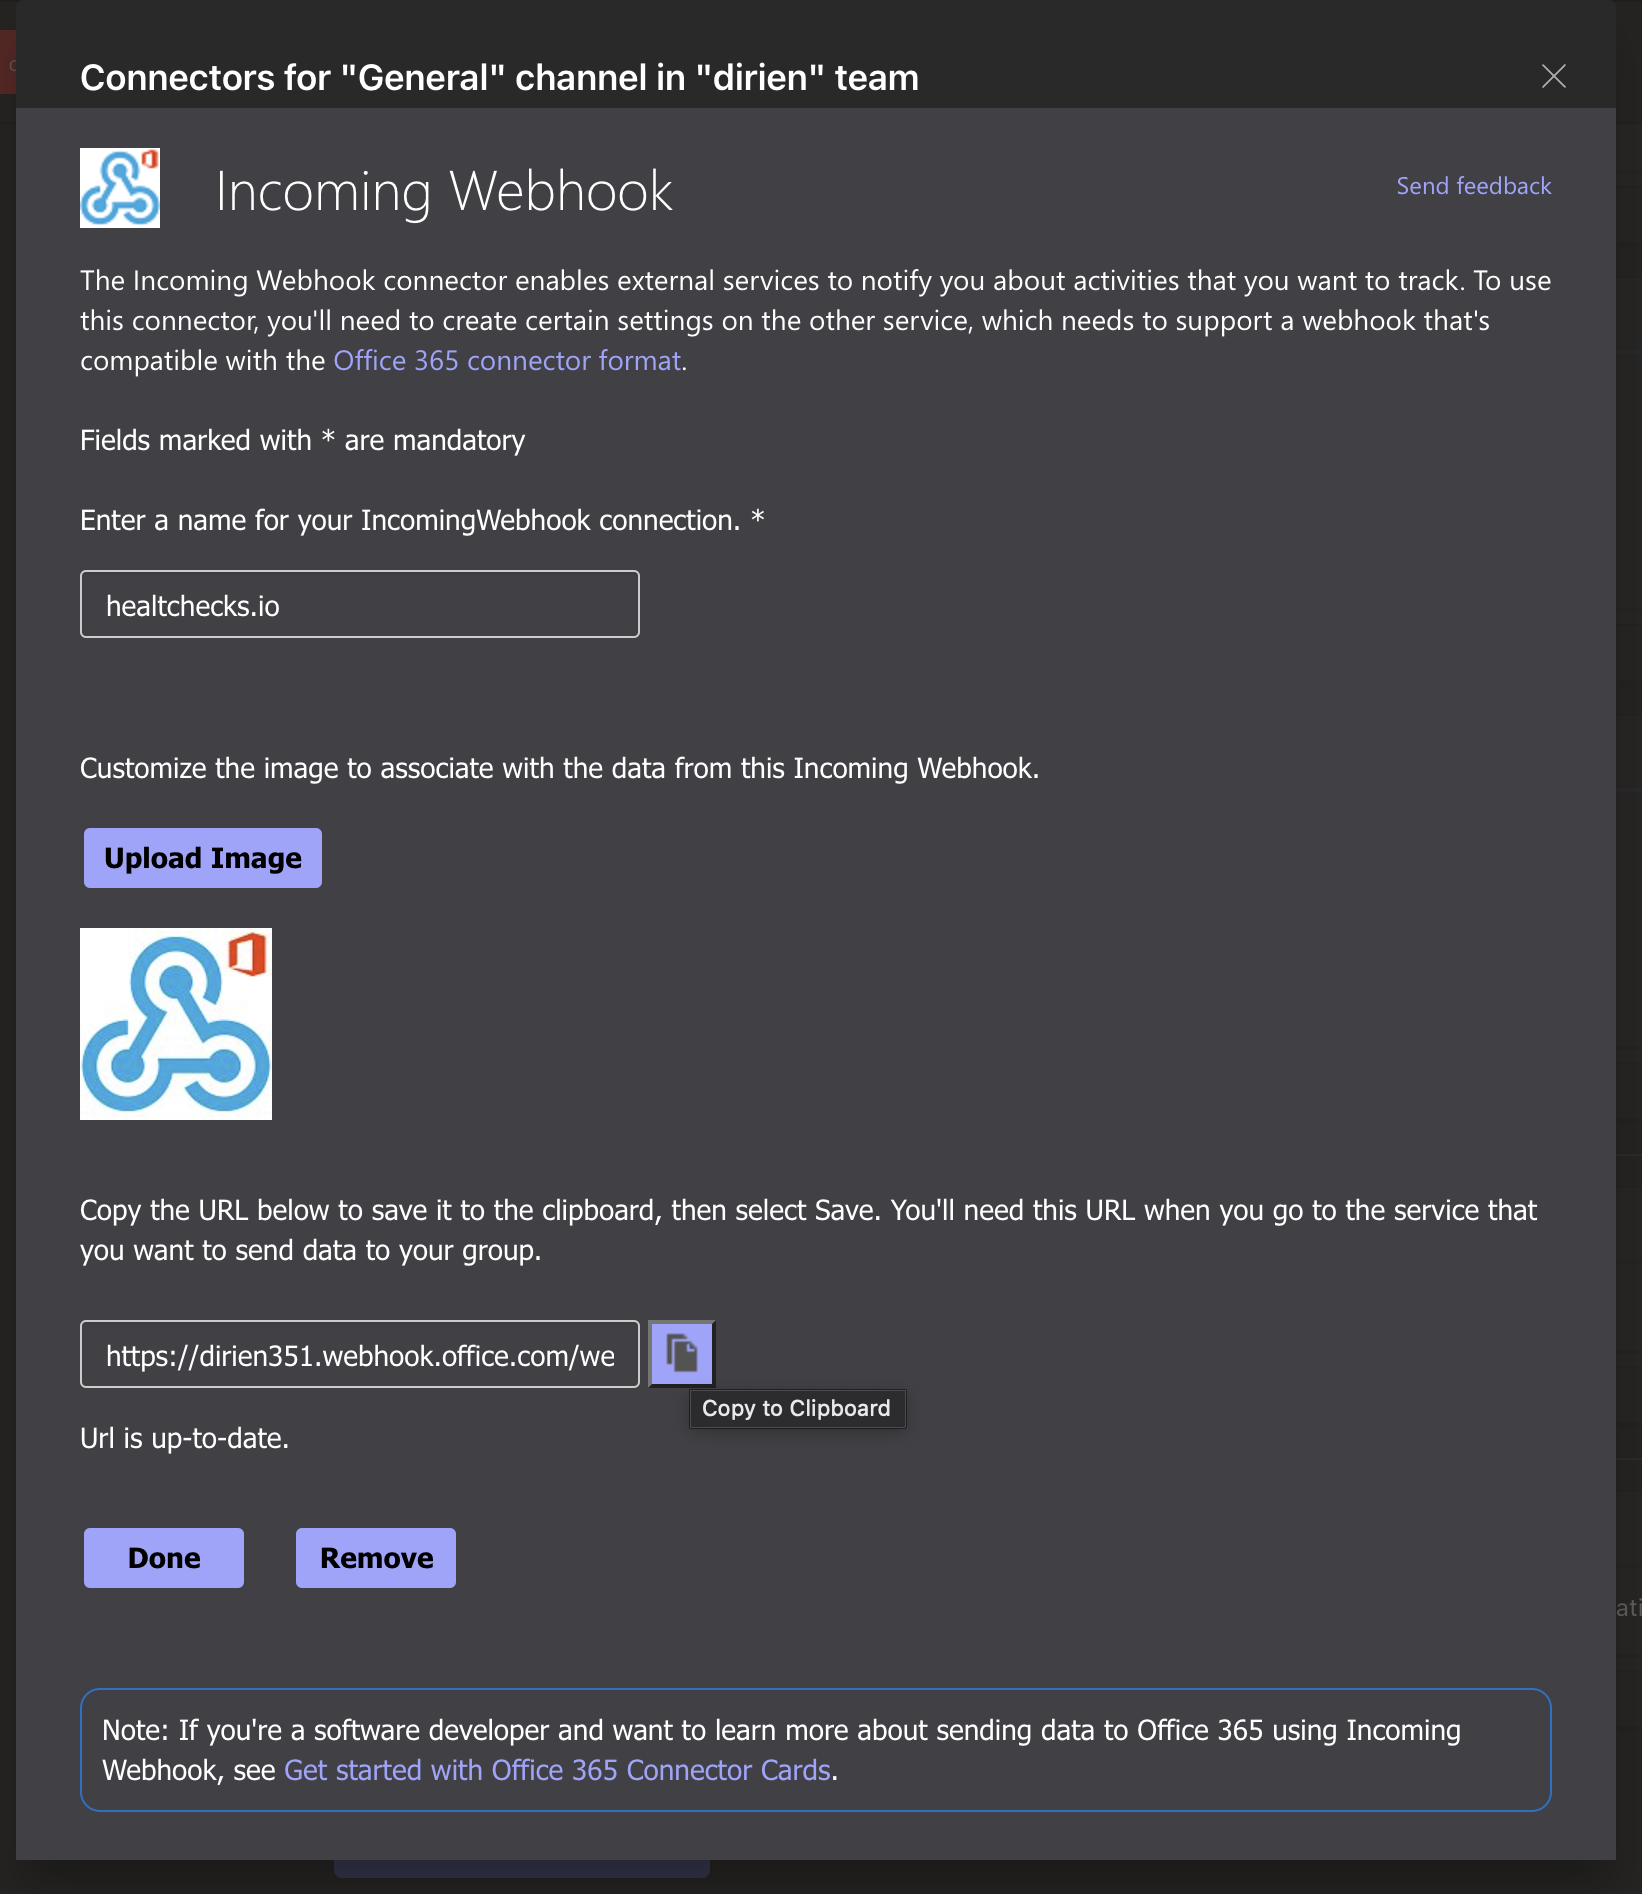
Copy the generated URL to your Clipboard
And add the Microsoft Teams integration to your check
You can now test the integration, to see if everything is setup correctly. Test the integration by clicking on the Send a test notification using this integration button. You should see a message in your Microsoft Teams

You should see the test message in Teams

Copy the Ping URL of your check, we will need it later in the configuration of the Alertmanager!
Deploying Prometheus and Alertmanager
I use the default values to deploy the kube-prometheus-stack Helm chart. The only thing I changed is setting the Alertmanager configuration to use the healthchecks.io service, when it receives it's not receiving an alert.
alertmanager:
  config:
    receivers:
      - name: 'null'
      - name: deadman
        webhook_configs:
          - url: "https://hc-ping.com/0988d7c0-5fe3-4e66-ab52-ee8d771b01e5"
    route:
      routes:
        - match:
            alertname: Watchdog
          receiver: deadman
          group_wait: 0s
          group_interval: 1m
          repeat_interval: 50s
prometheus-node-exporter:
  hostRootFsMount:
    enabled: false
helm repo add prometheus-community https://prometheus-community.github.io/helm-charts
helm upgrade -i monitoring prometheus-community/kube-prometheus-stack -f values.yaml
The good thing about the kube-prometheus-stack Helm chart is that there is already a Prometheus alert configured that acts as a heartbeat. The alert is called Watchdog and here is the alert rule:
      - alert: Watchdog
        annotations:
          description: |
            This is an alert meant to ensure that the entire alerting pipeline is functional.
            This alert is always firing, therefore it should always be firing in Alertmanager
            and always fire against a receiver. There are integrations with various notification
            mechanisms that send a notification when this alert is not firing. For example the
            "DeadMansSnitch" integration in PagerDuty.
          runbook_url: https://runbooks.prometheus-operator.dev/runbooks/general/watchdog
          summary: An alert that should always be firing to certify that Alertmanager
            is working properly.
        expr: vector(1)
        labels:
          severity: none
If you're going to write your custom alert, you can use this alert as a template. The important part is the expr field. The expression vector(1) will always return 1 and therefore the alert will always fire.
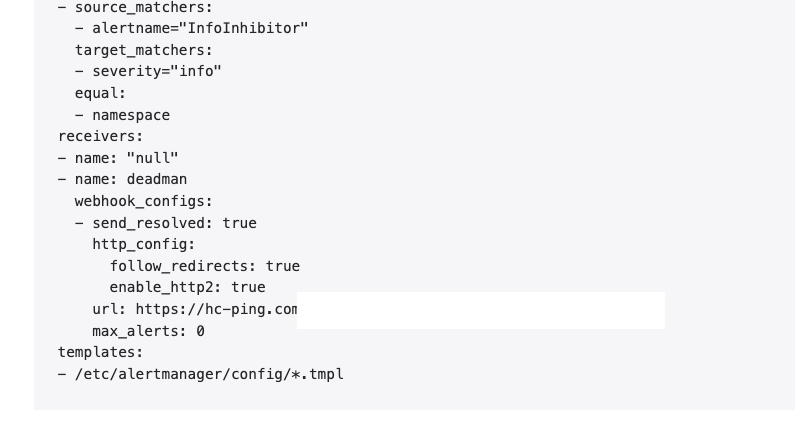
In the UI of the Alertmanager, you should see the config loaded correctly.
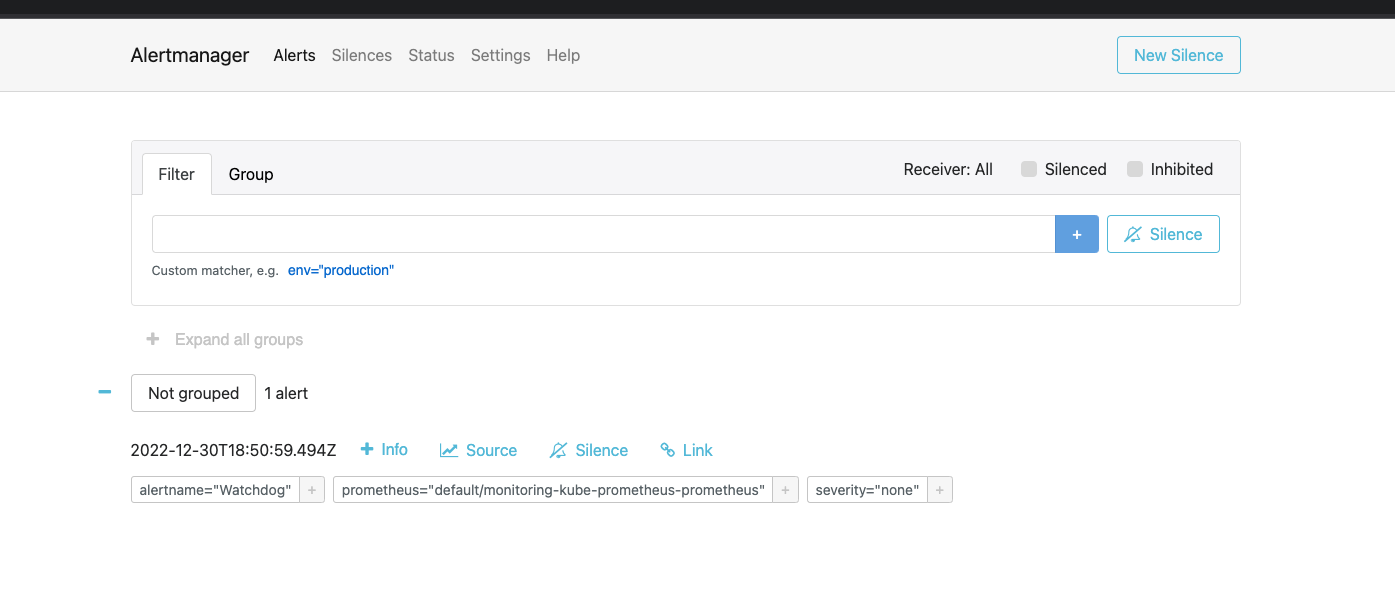
If everything went well, you should see the Watchdog alert firing in the Alertmanager dashboard.
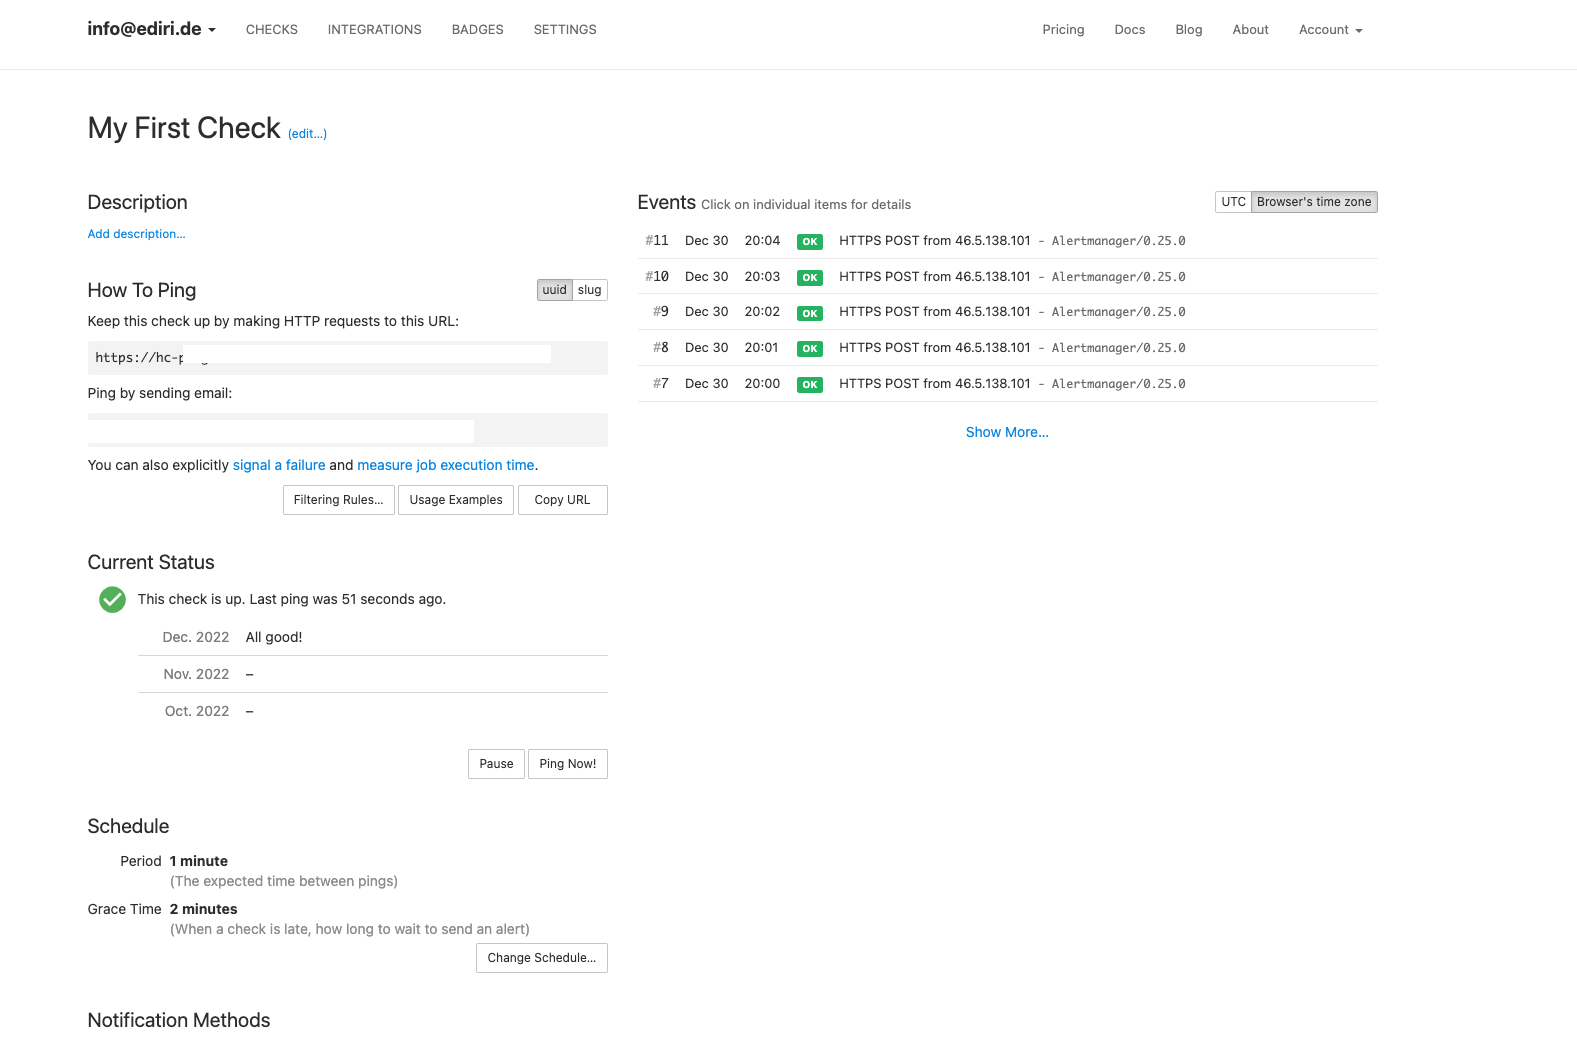
On the healthchecks.io dashboard, you should see that everything is as expected. The Check is ready to get pinged from the Alertmanager!
Let's break it!
Now that we have everything set up, let's break it and see what happens. For this I will scale down the Alertmanager and the operator to 0.
kubectl scale statefulset alertmanager-monitoring-kube-prometheus-alertmanager --replicas=0
kubectl scale deployment monitoring-kube-prometheus-operator --replicas=0
Le's see what happens in the healthchecks.io dashboard. We see should see in the status column that the check is late. This means that the check didn't receive a ping in the last 2 minutes.
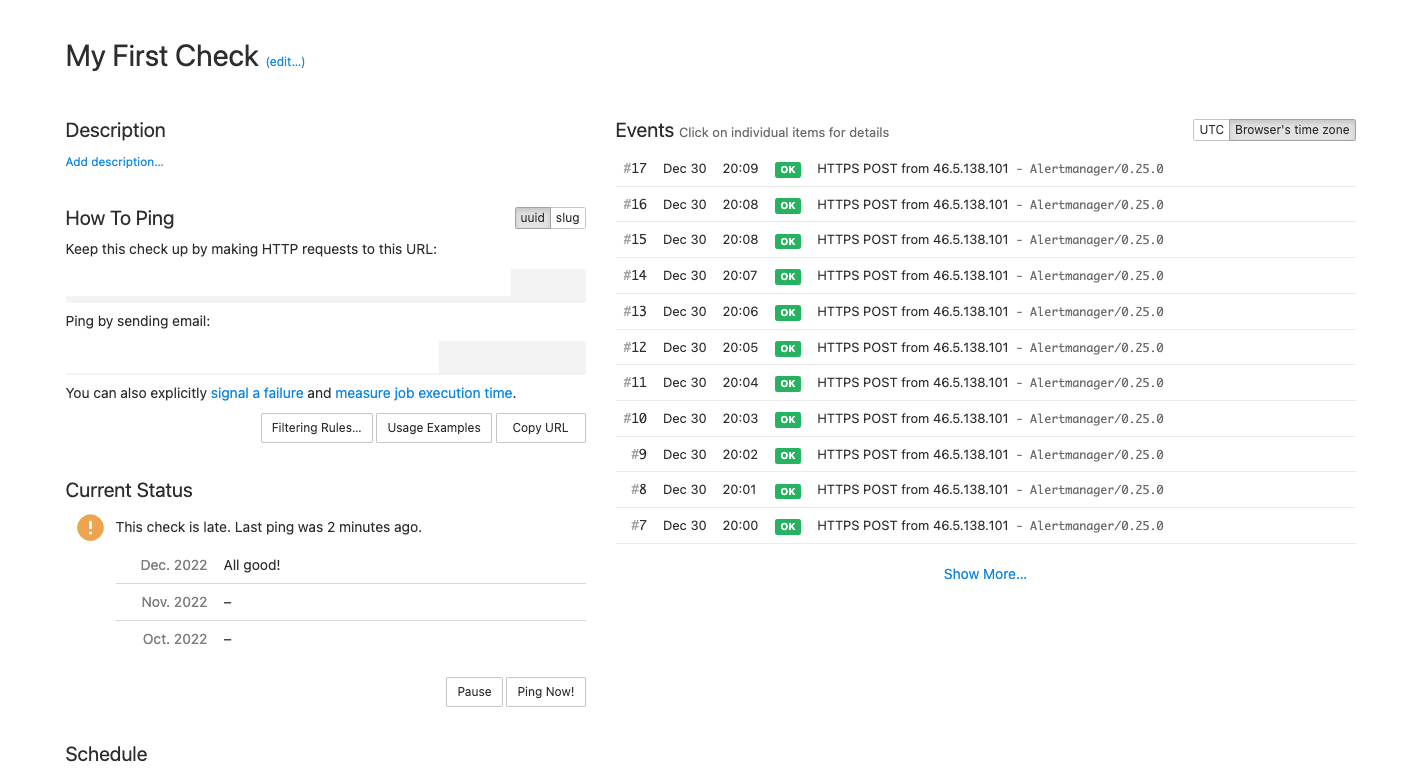
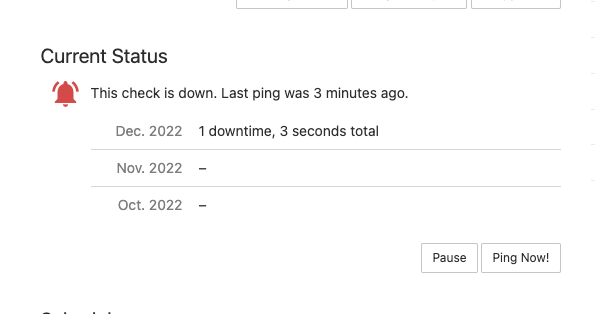
After the 2 minutes grace period, the check will send out an alert. You should see a message in your Microsoft Teams

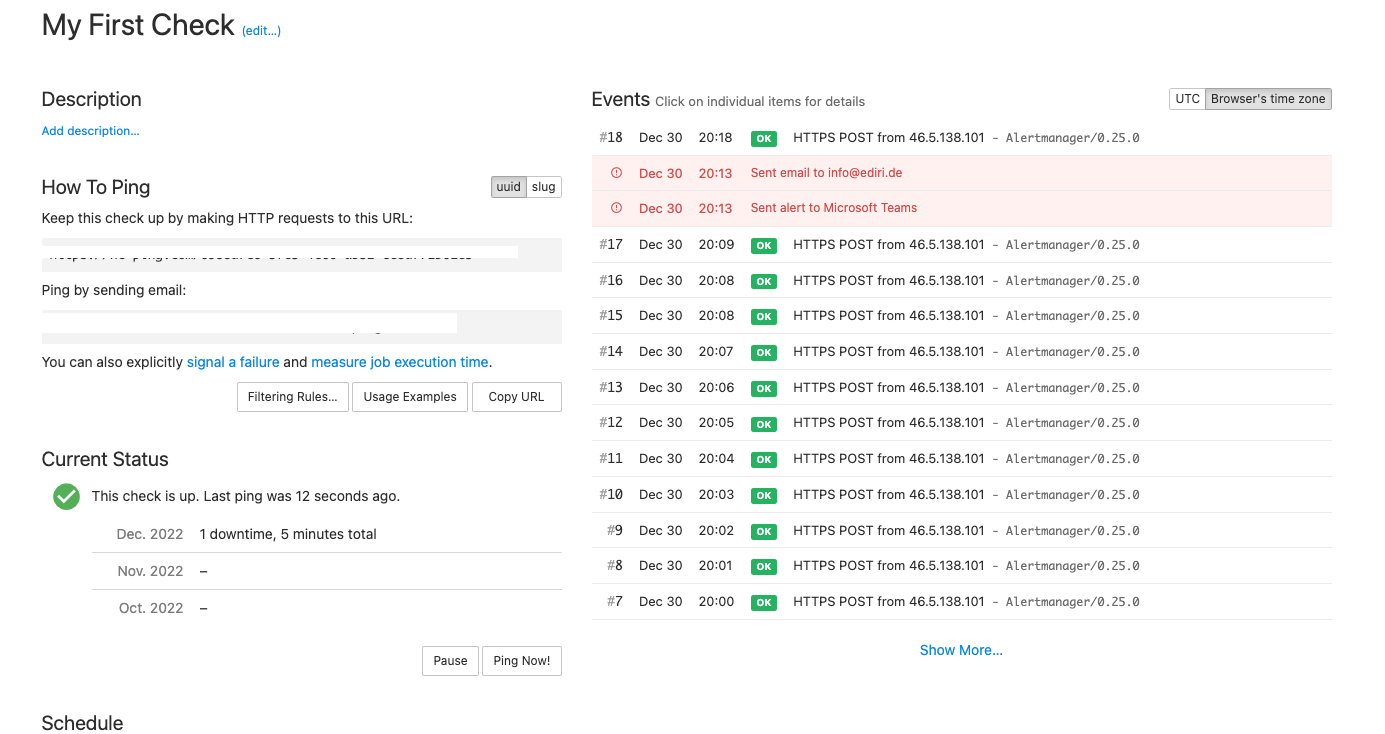
To fix the problem, we need to scale up the Alertmanager and the operator again.
kubectl scale statefulset alertmanager-monitoring-kube-prometheus-alertmanager --replicas=1
kubectl scale deployment monitoring-kube-prometheus-operator --replicas=1
After a few minutes, the check should be green again and you should see a message in your Microsoft Teams channel.

Conclusion
In this article, we learned how to create a dead man's switch implementation with Prometheus and Alertmanager. Of course, a dead man's switch is not a silver bullet but it is an important part of a monitoring system and helps to build a more robust monitoring system.
In the end, we need to make sure that our systems are up and running and if they are not, what can happen more often than we think, we need to be notified as soon as possible. This means also when the monitoring system itself is not working.
